
Wyckoff Method: Discover How the Market is Moving
Understanding the intricacies of price movements is paramount for day traders seeking consistent profitability. One powerful framework to analyze these movements is the Wyckoff Cycle. This method, devised by Wyckoff and early tape readers, unveils the cyclical nature of price action, shedding light on trends, ranges, and potential trading opportunities. It is the basis of most technical analysis techniques, whether traders realize it or not. I have broken down the big picture overview of the Wyckoff Cycle in a prior article (click here to read it). In this article, we will break down the Wyckoff Cycle into its simplest form: trends and ranges within price action. By understanding these basics and mastering the methodology, you can improve your analysis to identify the path of least resistance for price, and in turn improve your trading and profitability.
Waves and Market Movements
Cracking the Code of Waves
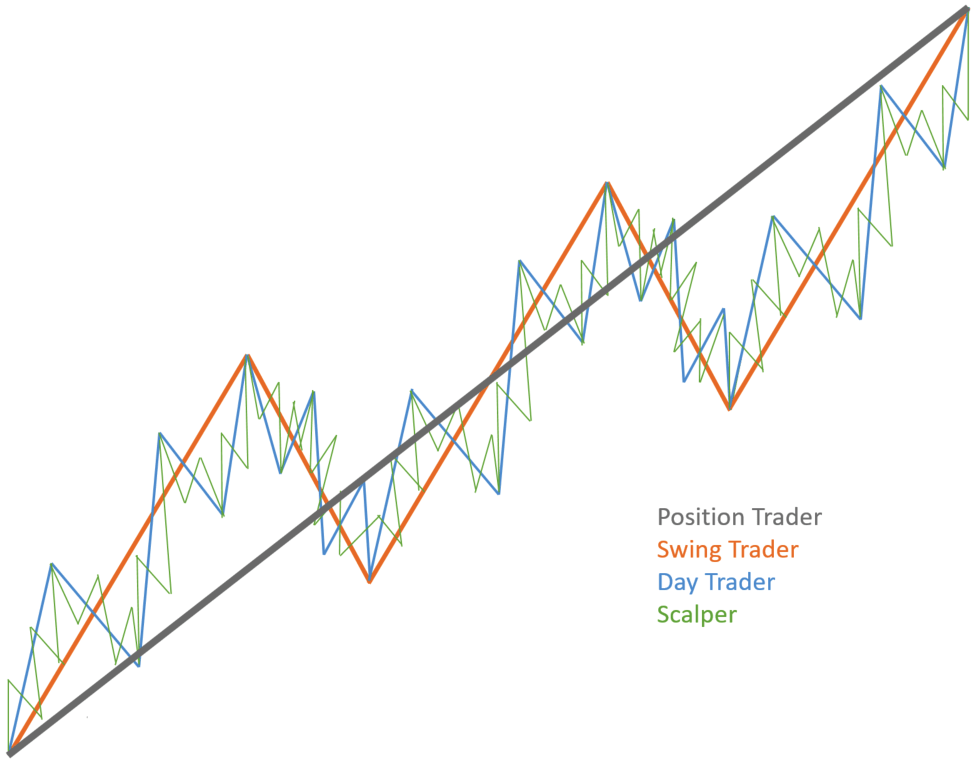
Wyckoff and early tape readers discovered that prices don't move linearly but in waves, varying in size and direction. These waves exhibit a fractal nature, forming a hierarchy where smaller waves nest within larger ones. By scrutinizing the relationship between upward and downward waves, traders gain insights into a trend's nature and strength. This is the foundation of multiple timeframe analysis, an analysis approach that we use and discuss daily in the Trader’s Thinktank. One of the easiest ways a developing trader can improve their hit rate and overall understanding of the market is to focus on what the higher timeframe waves (trend) are showing.
Decoding the Price Cycle
The market's basic structure encompasses two types of movement: trends and ranges. Trends, whether bullish or bearish, propel the market upward or downward - What Wyckoff would call markup or markdown. Ranges, in accumulation or distribution phases, highlight equilibrium points. Recognizing these phases empowers traders to align their strategies with the prevailing market conditions and structure, avoiding counterproductive moves. By identifying what cycle price is in, you can improve your probability of aligning with the most likely play of the day.
Mastering Trends for Profitable Trading
Trend Types and Durations
Identifying trends is fundamental for day traders. Trends can be bullish, bearish, or sideways, each offering distinct trading opportunities. Categorizing trends by duration (long, medium, short term) aids in strategic planning. Developing traders should start their analysis with long-term trends (weekly and daily timeframe charts) before checking the shorter timeframes (hourly, 30 min, 15 min, 5 min).
Multiple Timeframe Analysis - Types of Trends
Assessing Trend Strength
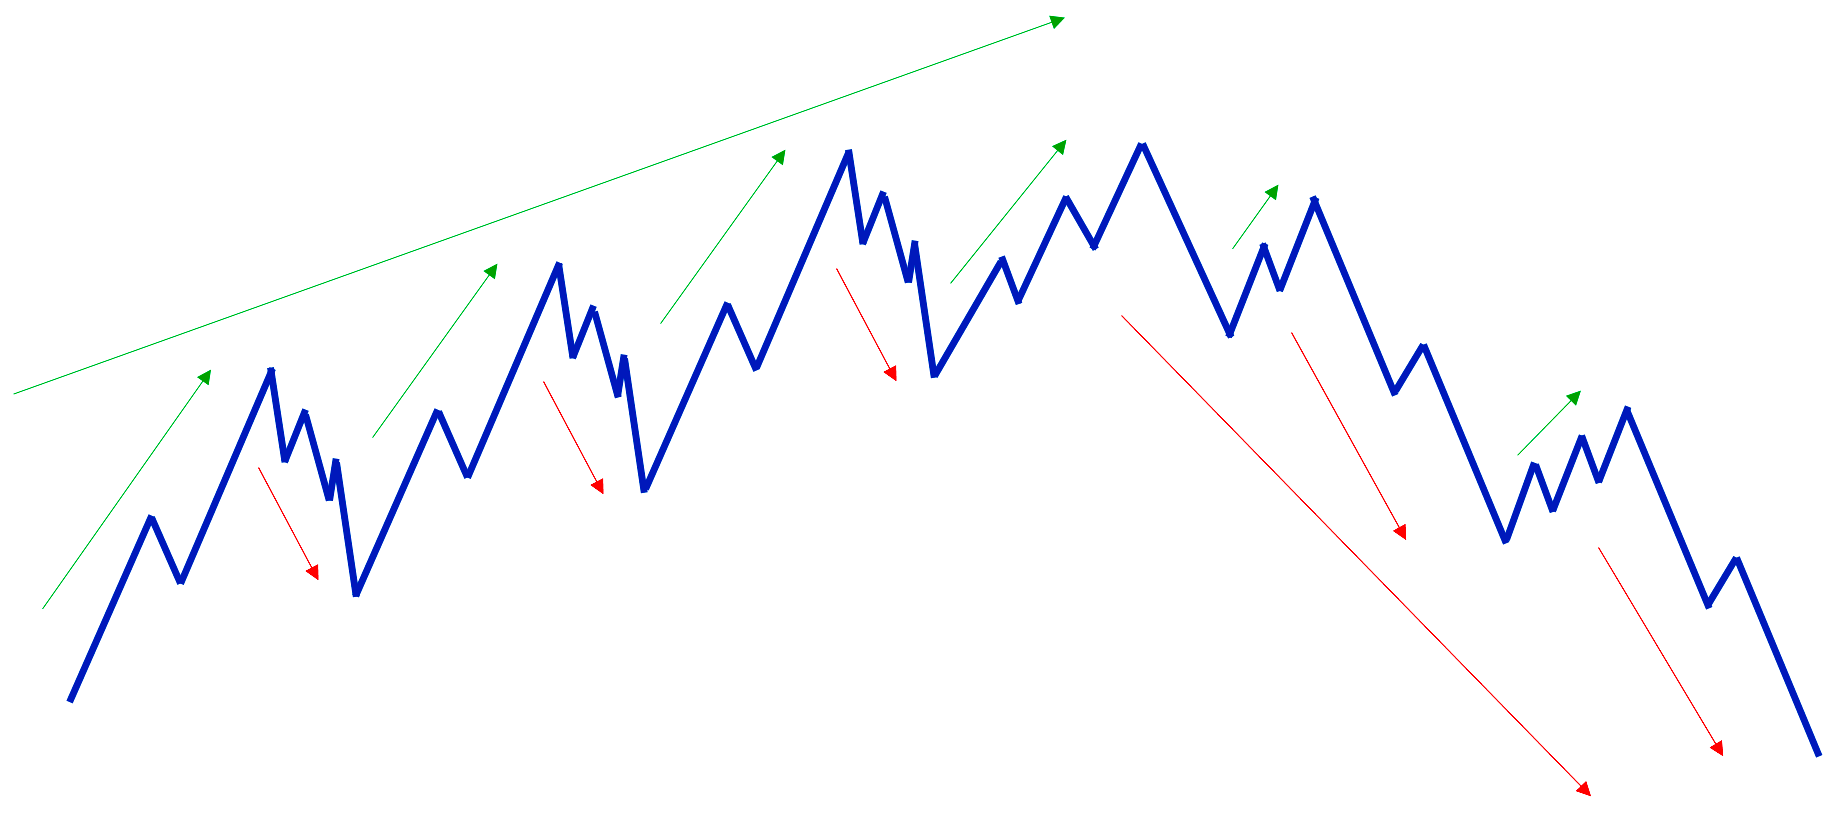
Successful trading hinges on understanding the dynamics of trend strength and weakness. Analyzing speed, projection, and depth provides valuable insights.
Speed refers to the angle at which the price moves; so if the price is moving faster than in the past, there is strength and price is likely moving with momentum. If on the other hand it is moving slower than in the past, it can suggest weakness.

The distance the impulse travels between 3 and 4 is greater than the distance between 1 and 2, which indicates strength. The distance the impulse travels between 5 and 6 is less than the run between 3 and 4 which indicates weakness
With projection, we evaluate the distance that the impulse moves travel and compare them with the previous moves to determine if the strength has increased or decreased.
For a trend to remain alive, each impulse move must surpass the previous impulse. If an impulse is not able to make new progress in the direction of the trend, it is an alert that the movement may be nearing its end and price will develop a new range or reverse.
With depth analysis we evaluate the distance travelled by trend reversals to determine whether weakness has increased or decreased. Depth analysis is quite similar to projection, and if you use fibonacci levels in your trading you’ll be quite familiar with this. Comparing current movements with historical data unveils the market's health, allowing traders to make informed decisions.
Lines: Guiding the Way
Utilizing lines, both horizontal and trend, is crucial for evaluating trend strength. Horizontal lines identify support and resistance zones, while trendlines guide traders on potential entry and exit points. That said, remember that trends are ultimately defined by market structure - Not by trend lines. Trend lines are more useful for identifying the rate of change of a particular trend, as their subjective nature makes them a subpar analysis tool for the developing trader. Focus primarily on horizontal lines. They are objective, and will greatly improve your hit rate and quality of your analysis.

Navigating Ranges: The Wyckoff Approach
The Importance of Ranges
Ranges represent the equilibrium between supply and demand, serving as breeding grounds for future trends. Positioning yourself near the edges of a range provides an edge in catching significant price movements. The best opportunities to trade a range are always near the edges. Analyzing price action and volume before and during range development is key to anticipating future trends. For example, if the range follows a trend higher, a question to ask is whether the range is showing signs of re-accumulation or distribution.
Identifying Range Phases
Understanding the purpose behind a range—accumulation, distribution, or neutral oscillation—is crucial. Recognizing professional interest within a range ensures that market movements are not merely random fluctuations. The time spent within a range directly correlates with the subsequent movement's magnitude. Like we say in the Trader’s Thinktank, “The longer the base, the higher in space” - Which essentially means that the longer price coils into a range, the larger the breakout will be.

Different types of trading ranges
Breaking Ranges: A Precursor to Trends
The decisive move to break a range and initiate a trend is contingent on a clear supply-demand imbalance. Professionals must confirm the path of least resistance before confirming a new trend or continuation. Be sure to monitor extremes within a range, as breaking these points can signal lucrative trading opportunities, such as springs and upthrusts.
Conclusion
Mastering the Wyckoff Cycle is a potent tool for day traders seeking an analytical edge in deciphering market movements. From understanding wave patterns to navigating trends and ranges, this method equips traders with the insights needed to make informed decisions. By applying these principles, day traders can strategically position themselves within the market's ebbs and flows, optimizing their chances for success. If you need help navigating markets, apply for the One-on-One Trading Mentorship.