
Understanding Wyckoff's Market Phases for Informed Trading
To navigate the complexities of the financial market effectively, one must grasp the distinctive phases proposed by Wyckoff's theory. The Wyckoff Cycle is something that I personally use to underpin all of my technical analysis. It starts with a top-down approach using multiple timeframe analysis. From there, I look for the specific details mentioned below to help establish where price is within the cycle. These phases offer critical insights into when to enter or exit the market and illuminate the role of significant players in shaping market trends and price action.
Phase A: Accumulation
In Phase A, supply typically dominates, but signs of supply exhaustion start to emerge. These signs manifest as Preliminary Support (PS) and the Selling Climax (SC), often accompanied by a widening spread and high volume as panicked public selling is absorbed by professional interests. Following this intense selling, an Automatic Rally (AR) ensues. A successful Secondary Test (ST) showcases decreased selling compared to the SC and narrows the spread. These price levels, along with the AR high, define the boundaries of the Trading Range (TR). Phase A may not always exhibit dramatic spread and volume expansion, but these traits are desirable as they clear out sellers, paving the way for a sustained uptrend.
When a TR represents reaccumulation, Phase A resembles Phase A of basic Wyckoff distribution, marking the previous trend's halt. Phases B through E in reaccumulation mirror their counterparts in initial accumulation.
Phase B: Building the Cause
Phase B serves to establish a cause for the upcoming effect. Supply and demand reach a balance, and no decisive trend is apparent. Early in Phase B, price swings are wide, with erratic volume. As the TR progresses, supply weakens, and demand strengthens as professionals absorb supply. Volume tends to diminish as the TR nears its end. Support and resistance lines contain price action in Phase B, defining the testing process in Phase C. Penetrations (or lack thereof) of the TR help gauge supply and demand dynamics.
Phase C: Testing
Phase C is the testing phase where smart money operators determine if the asset is ready for the markup phase. The stock may exit the TR with higher tops and bottoms or undergo a downside "spring," breaking previous support before climbing upward. A spring is a false signal that traps late sellers, as it appears to confirm a downtrend's resumption. The depth of the price move to new lows and the relative volume reveal supply strength during the penetration.
Until this testing phase, one cannot be certain the TR signifies accumulation, necessitating caution in taking a position. A thorough analysis and monitoring of the TR provide confidence in an impending uptrend, with exhausted supply and clear risk points.
Phase D: Markup
Phase D marks the dominance of demand over supply, characterized by advances (SOSs) with widening spreads and increasing volume and reactions (LPSs) with narrower spreads and reduced volume. If this pattern fails to materialize, it's prudent to avoid adding positions and wait for conclusive evidence of markup. Phase D offers opportunities to add to positions as the asset prepares to leave the TR, backed by Wyckoff's point-and-figure method. Generally speaking, I am usually looking for swing trades during late-stage phase C or within phase D. I have found this to be one of the best times to get great entries for swing plays. On that note, if you are interested in learning more about our swing trades, check out the Swing Trade Radar.
Phase E: Uptrend Unfolding
Phase E signifies the unfolding uptrend, with demand in control and feeble sell-offs.
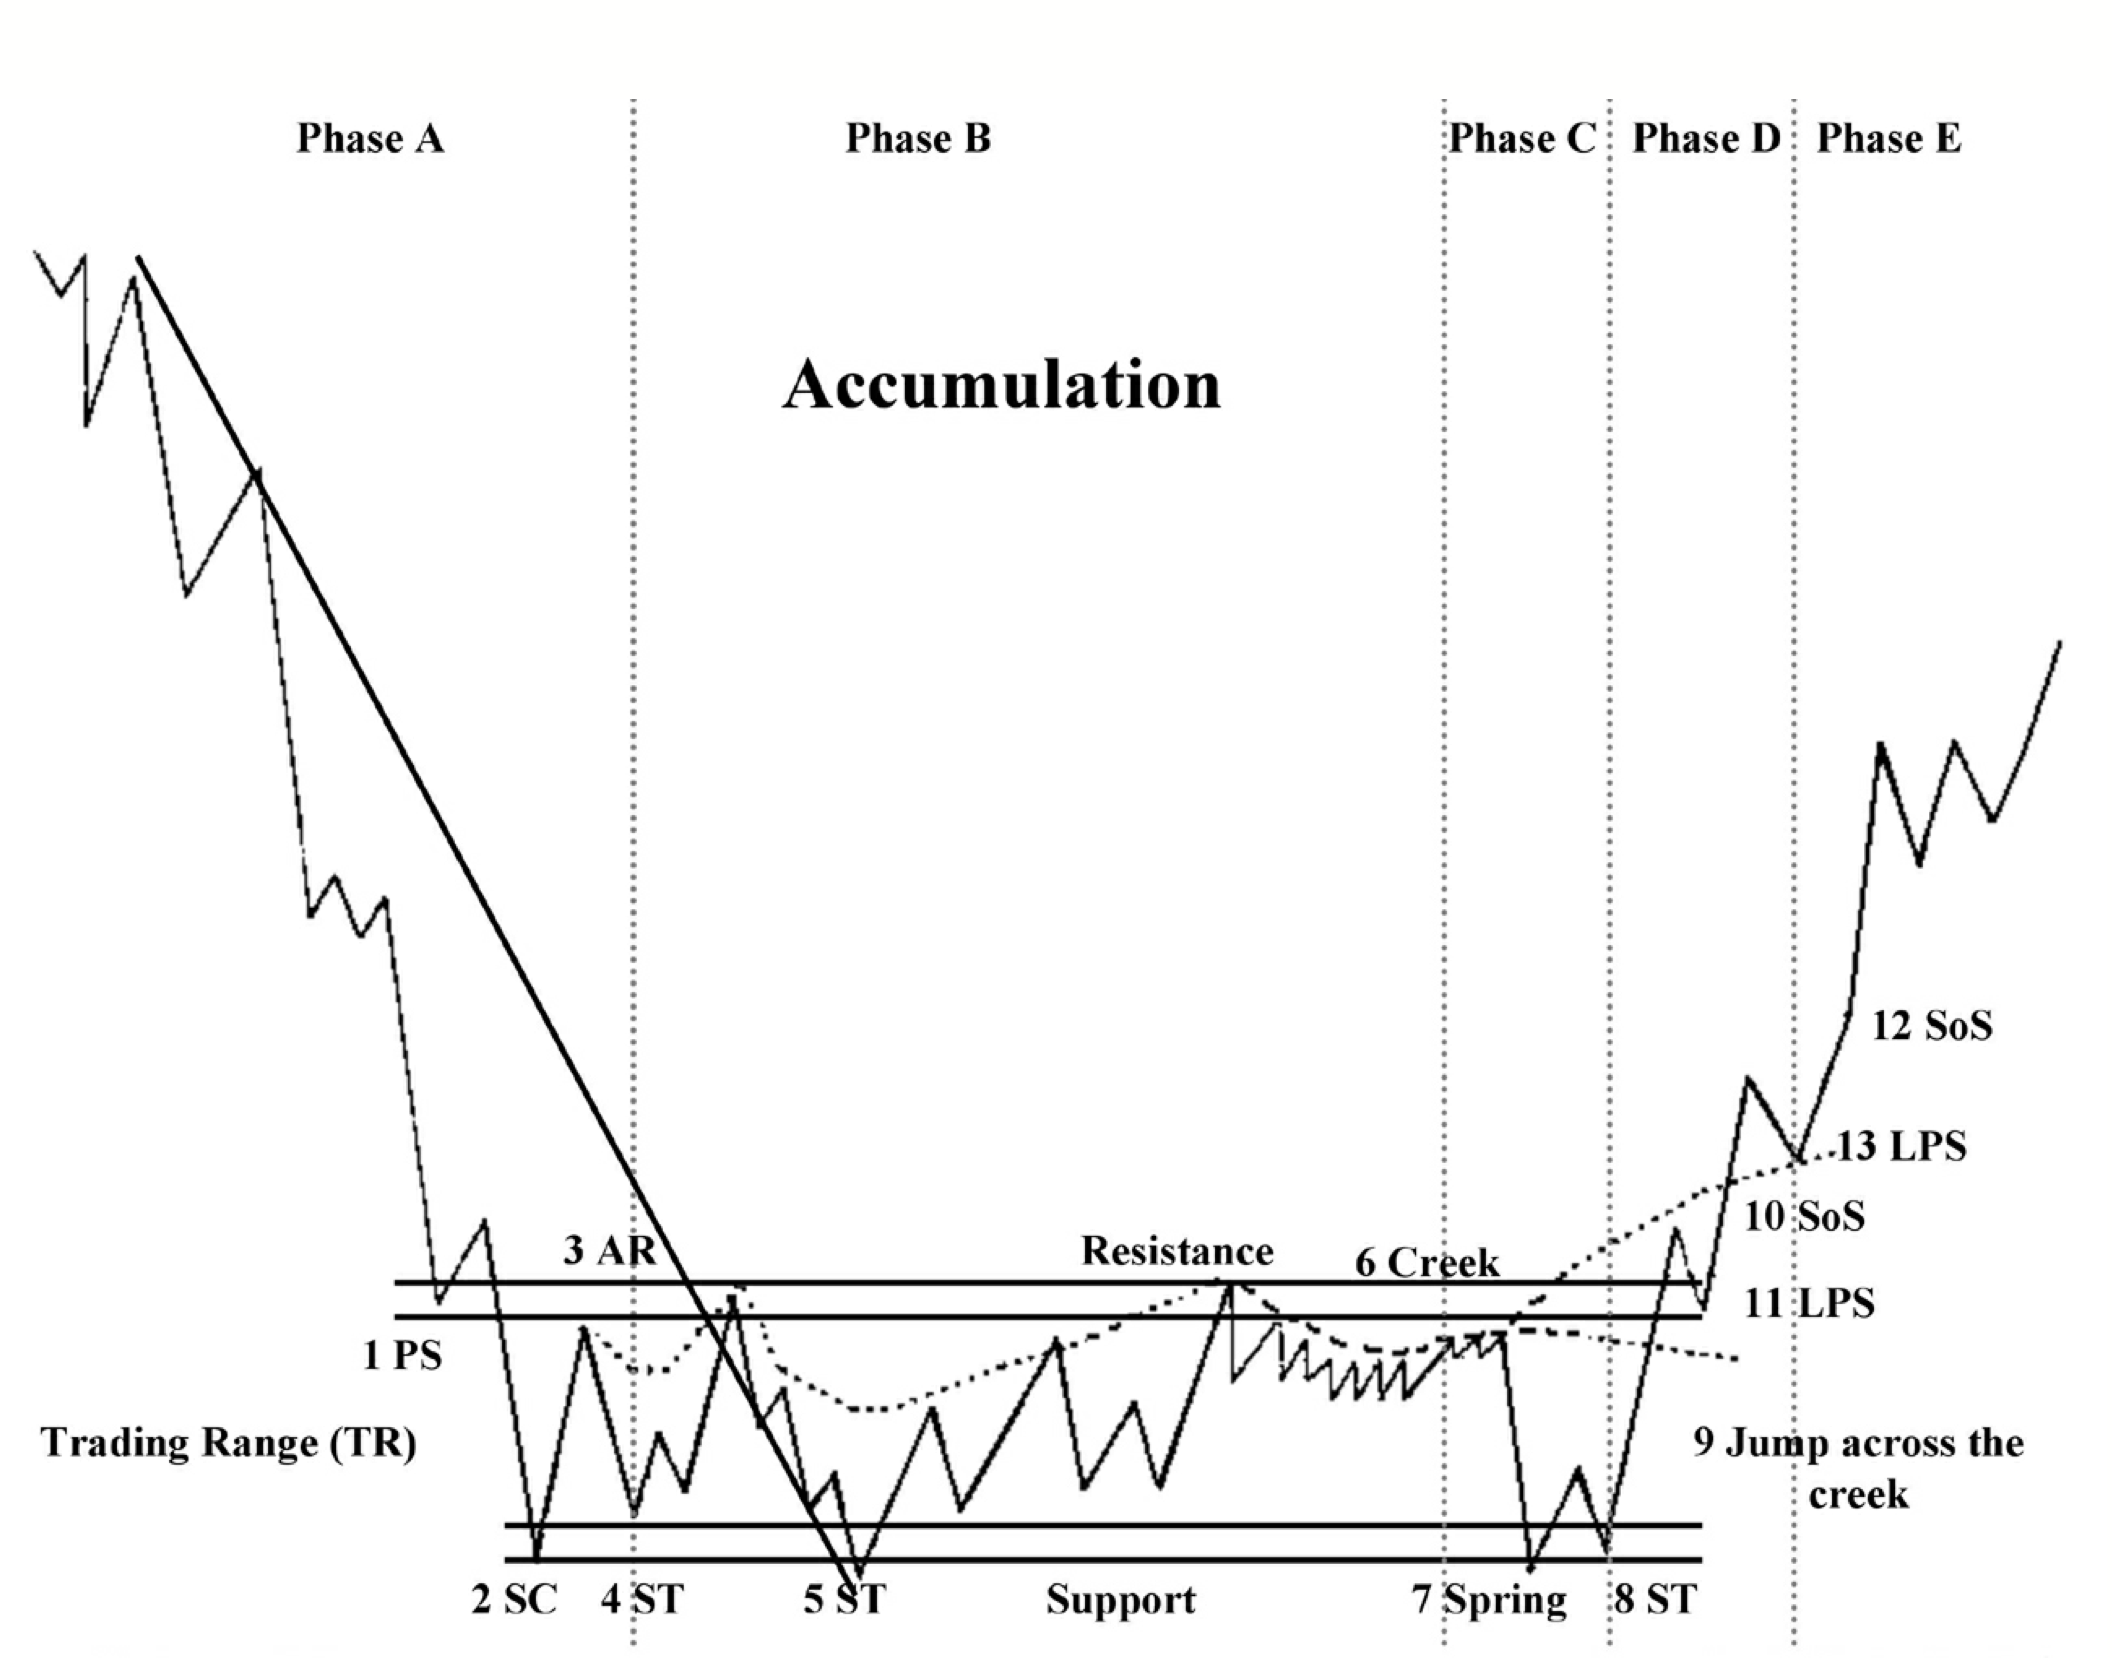
Wyckoff Accumulation Schematic
Understanding Wyckoff Accumulation and Distribution Events
Accumulation Events:
PS (Preliminary Support): Marks the start of pronounced support after a prolonged downtrend, accompanied by increasing volume and widening spread.
SC (Selling Climax): Represents a climax of selling pressure, often followed by an AR.
AR (Automatic Rally): Occurs as intense selling pressure diminishes.
ST (Secondary Test): A test of the SC area with reduced volume and spread.
Distribution Events:
PSY (Preliminary Supply): Large interests begin unloading shares after an uptrend, signaled by expanding volume and spread.
BC (Buying Climax): The peak of buying pressure, often occurring with an earnings report or positive news.
SOW (Sign of Weakness): Downward move below the TR, usually on increased volume and spread.
LPSY (Last Point of Supply): Represents exhaustion of demand and the last distribution before the markdown.

Wyckoff Distribution Schematic
By diligently applying Wyckoff's principles and analyzing trading range dynamics, traders can identify favorable opportunities and effectively manage risk, enhancing their prospects for success in the financial markets. As I mentioned previously, the technical analysis that I personally do is underpinned by a fundamental understanding of Wyckoff Cycle. Do you need to know this information to be profitable in the markets? Absolutely not, but it is helpful knowledge if you are a technical trader. If this is too complex and you are looking for something that is easier to identify and manage, I encourage you to check out the Two Hour Trader framework.