
Understanding Market Structure in Trading: A Comprehensive Guide
Market structure plays a vital role in the world of trading, providing valuable insights into price movements, trends, and potential trading opportunities. Traders who grasp the concepts of market structure can gain a competitive edge in the market. In this article, we will explore what market structure is, its significance in trading, how to utilize it effectively, the best assets for market structure analysis, optimal time frames, examples of trade setups, as well as the advantages and limitations associated with this approach.
📌 Want to improve your trading decisions? Join my FREE daily livestreams where I analyze market structure in real-time for 60-90 minutes every trading day. See exactly how I identify setups and execute trades based on the principles in this article. JOIN TODAY'S LIVESTREAM →
What Is Market Structure?
Market structure refers to the underlying framework that defines the organization and dynamics of a market. It encompasses various elements that shape price action and market behavior. When analyzing market structure, traders closely examine price charts to identify key components such as significant price levels, trends, support and resistance zones, and the overall market context. These components form the building blocks of market structure and provide valuable insights into the market's anatomy, and is the foundation of of how a trade idea is created.
Market structure can take different forms, including trending markets characterized by higher highs and higher lows (see image below) or ranging markets with price consolidations and horizontal price movements. By understanding and interpreting market structure, traders can assess the overall market sentiment, recognize patterns, and make informed trading decisions based on the observed structural dynamics. As a trader, an in-depth understanding of market structure is what will enable you to trade with naked charts (no indicators). This is one of the main things we focus on in the Trader’s Thinktank, and a big component of our daily livestreams.
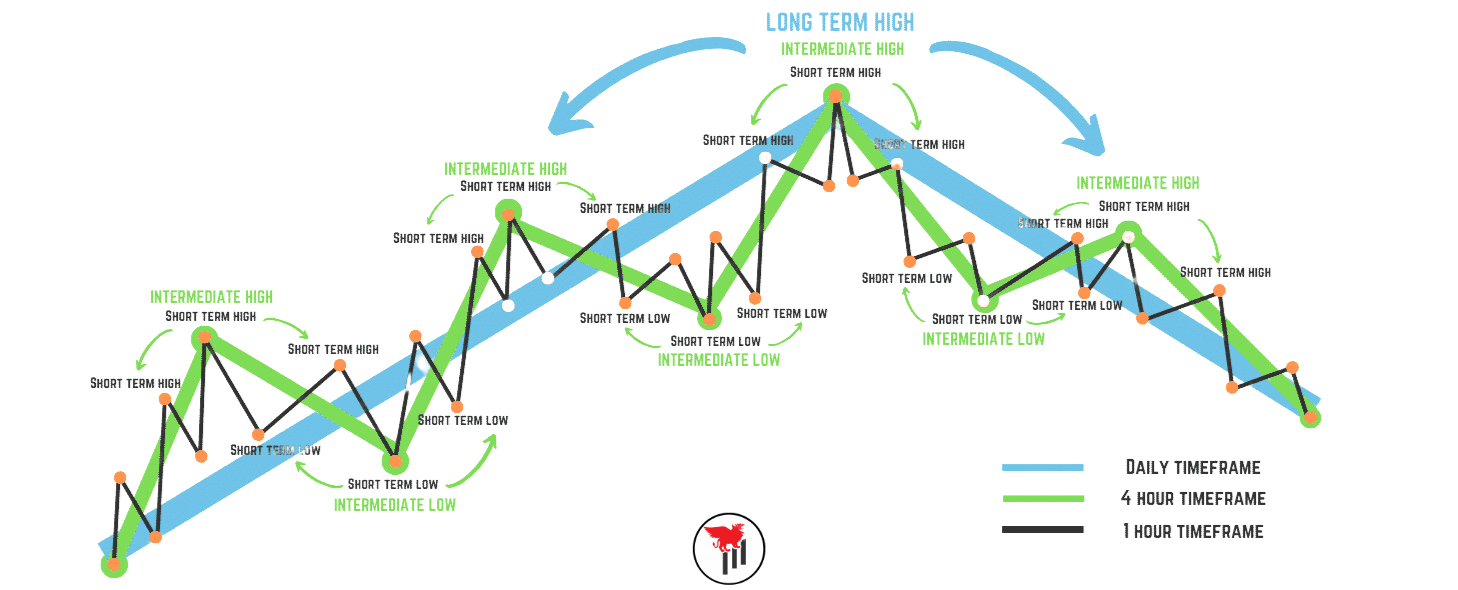
An example of market structure
The Difference between Market Structure and Price Action
While market structure and price action are closely related, they each provide distinct perspectives on the market. Market structure analysis focuses on understanding the broader organizational framework of the market. Traders employing market structure analysis aim to identify key levels, patterns, and trends that shape the market's overall behavior. By studying market structure, traders gain insights into the positioning of buyers and sellers, the dynamics of supply and demand, and the sentiment of the market participants as a whole.
On the other hand, price action analysis delves specifically into the movement of prices over time. It examines the individual candlesticks or bars on a price chart, analyzing their open, high, low, and close prices, as well as the patterns and formations they create. Price action analysis helps traders understand the immediate interaction between buyers and sellers at a micro level. It focuses on deciphering the underlying motivations, market psychology, and trading strategies of market participants based on how prices react and evolve.
While price action analysis offers insights into the short-term dynamics and specific trading signals, market structure analysis provides a broader perspective of the market's organization. By combining both approaches, traders can gain a comprehensive understanding of the market's dynamics and make more informed trading decisions. Market structure analysis sets the foundation by identifying key levels and trends, while price action analysis refines the analysis by examining the intricacies of individual price movements and patterns. Together, they form a powerful framework for understanding and navigating the complexities of the market. By using both price action and market structure, a trader can begin to develop a real trading edge.
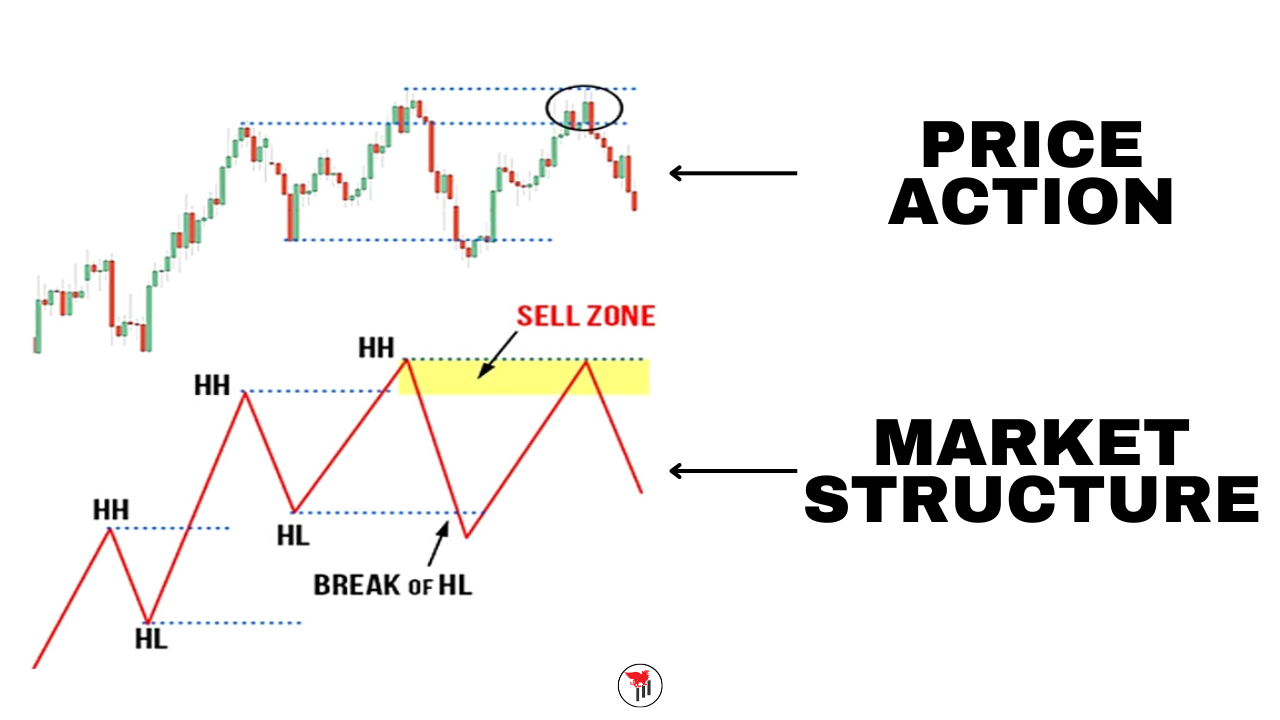
Visual of price action versus market structure
Why Is Market Structure Important in Trading?
Market structure plays a crucial role in trading, providing traders with a valuable roadmap for navigating the markets. By analyzing market structure, traders gain insights into the underlying market sentiment, potential turning points, and areas of interest for entering or exiting trades. This understanding empowers traders to develop a systematic approach that enhances their decision-making process.
One of the key benefits of market structure analysis is improved risk management. By identifying key support and resistance levels, trends, and chart patterns, traders can effectively gauge the potential reward-to-risk ratio for each trade. This allows them to set appropriate stop-loss levels and profit targets, thereby managing their risk more efficiently.
Moreover, market structure analysis helps traders to develop a real edge in the markets. By recognizing significant market levels and understanding the dynamics between buyers and sellers, traders can identify high-probability trade setups. These setups provide them with a competitive advantage, as they are able to align their trades with potential reversals or continuations in price movements.
Having this edge is crucial for generating profits in trading. While no strategy can guarantee success in every trade, understanding market structure significantly enhances the probability of profitable trades. It allows traders to identify favorable risk-to-reward opportunities, make informed trading decisions, and trade with market trends. By mastering market structure analysis, traders can gain a competitive advantage and increase their chances of success in the dynamic world of trading.
How to Use Market Structure?
Traders can employ a range of techniques to effectively utilize market structure and enhance their trading strategies. One key aspect is identifying key support and resistance levels, which are levels where price has historically reversed or stalled. Support levels are areas where buying pressure has been strong enough to prevent further price declines, often marked by higher lows. Resistance levels, on the other hand, are areas where selling pressure has halted price advances, typically characterized by lower highs. By identifying these levels, traders can anticipate potential price reactions and make more informed decisions on entry, exit, and risk management.
Trend lines are another powerful tool in market structure analysis. They are drawn by connecting higher lows in an uptrend or lower highs in a downtrend, providing visual representations of the market's direction. Traders can use trend lines to gauge the strength of a trend and identify potential trend reversals. Remember that trend lines are primarily used to highlight a rate of change. A true trend is established within the structure, via higher highs and higher lows or vice versa.
Chart patterns, such as double tops/bottoms and head and shoulders patterns, are recognizable formations that often signal trend exhaustion and potential reversals. These patterns are identified by specific price movements and can provide valuable insights into market sentiment and potential trading opportunities. That being said, most chart patterns are overrated in the trading community. An understanding of support and resistance is all you need to establish a profitable trading strategy.
By combining these tools and techniques, traders can develop robust trading strategies based on market structure principles. This involves understanding the overall market context, recognizing key levels, identifying trends, and using indicators to confirm signals. By aligning their trades with market structure dynamics, traders can increase their probability of success and optimize their risk-to-reward ratios.
Please note that these are general techniques used in market structure analysis, and traders should adapt them based on their individual trading styles, timeframes, and risk tolerance. If you want to learn how to actually identify market structure on your own, and how to build a trading strategy with it, we recommend signing up for the Trading Mentorship Group or the One on One Mentorship Program. Additionally, if you want live market structure analysis and commentary, join us in the Trader’s Thinktank where we discuss the markets and trade live (on stream) every day.
Which Assets Work Best With Market Structure?
Market structure analysis can be applied to various financial instruments, including stocks, commodities, forex, and cryptocurrencies. While the principles remain similar across different assets, it is important to adapt the analysis techniques to the specific characteristics and behaviors of each market. In the Trader’s Thinktank, we use market structure and price action in individual stocks and the index (SPY, QQQ, SPX, ES, etc).
What Is the Best Time Frame to Identify Market Structure?
The optimal time frame for identifying market structure largely depends on individual trading styles and preferences. Shorter time frames, such as intraday charts, provide more granular details and are suitable for day traders. Conversely, longer time frames, such as daily or weekly charts, provide a broader view of market structure, making them suitable for swing traders or investors. That being said, the best trade opportunities develop when multiple timeframes are in alignment - This is called multiple timeframe analysis.
Examples and Trade Setups Using Market Structure:
Market structure analysis can be illustrated through practical examples and trade setups. For instance, identifying a breakout above a key resistance level on a daily chart can present a potential long trade opportunity. Similarly, recognizing a bearish trend reversal at a significant support level may signal a potential short trade.
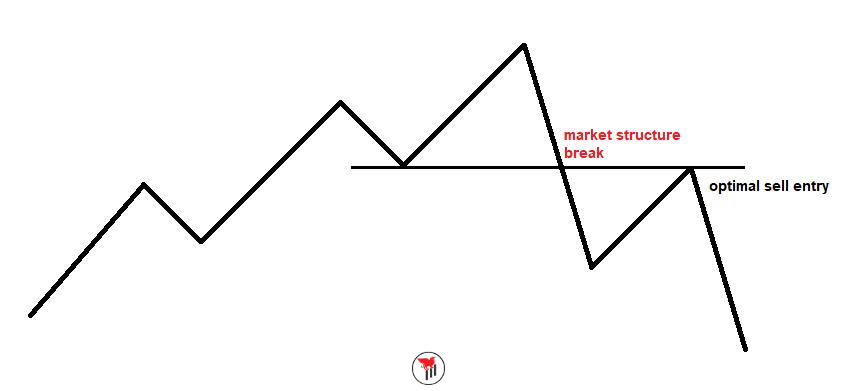
Market Structure Entry Example
📈 These examples are just the beginning. In the Trader's Thinktank, we analyze dozens of setups daily and execute trades based on these exact principles. See market structure analysis in action during our daily livestreams and accelerate your trading journey. JOIN THE THINKTANK →
Frequently Asked Questions about Market Structure:
Q1: How can I learn more about price action and market structure? Traders can gain in-depth knowledge about price action and market structure principles through our daily market analysis and live commentary trading streams, which are hosted daily in the Trader’s Thinktank.
Q2: How can I stay updated on market structure developments in real-time? Traders can join the Trader's Thinktank, an active trading community, to stay connected with other traders, share insights, and discuss market structure developments in real time.
Q3: How do I identify key support and resistance levels in market structure analysis? Key support and resistance levels can be identified by looking for areas where price has historically reversed or stalled, such as previous swing highs or lows.
Q4: Can market structure analysis be combined with other trading strategies? Absolutely! Market structure analysis can be combined with various trading strategies, including trend following, breakout trading, and mean reversion, to enhance trading decisions and increase profitability.
Ready to master market structure analysis?
📊 Experience daily livestreams & live trade analysis in the Trader's Thinktank JOIN NOW →
📚 Follow a structured learning path in our Trading Mentorship Group LEARN MORE →
👨🏫 Accelerate your growth with personalized 1-on-1 mentoring APPLY TODAY →
Conclusion
Market structure analysis is a powerful tool for traders, enabling them to navigate the complexities of the market with increased confidence and precision. By studying market structure, traders can identify key levels, spot trends, and capitalize on potential trading opportunities. While market structure analysis is not infallible, it provides a solid foundation for making informed trading decisions and achieving long-term profitability in the ever-changing world of trading.