
Relative Volume (RVOL) - The Day Trading Filter You Need
The Opinicus team has been using and posting about volume and relative volume for a number of years now, and for good reason. We first introduced our ThinkOrSwim volume data Thinkscript back in March of 2019, and since then it has seen over 10,000 downloads from active traders. While this tool does have its drawbacks, it has been and continues to be a great indicator to help traders sort and filter stocks to trade. By checking each stock’s respective current-day volume and how it compares to the average, traders are able to get a sense of the relative volume in the particular stock they are looking at.
What is Relative Volume?
Relative volume (also known as RVOL) is perhaps the most important day trading filter in a trader’s toolkit. Relative volume tells traders how current trading volume is compared to past trading volume over a given period - More simply put, relative volume tells us how many shares have traded in relation to how many shares usually trade.
The best RVOL tools show you not only that data, but will also show how volume compares over a given period at that specific time of day as well. This is a powerful way to look at volume, because volume throughout the trading day is not linear - The open and close are always going to show higher volume than say late morning or mid-day. Generally speaking, RVOL is displayed as a ratio. For example, if a stock trading two and a half times its normal volume, that would displayed as 2.5RVOL.

How Do Traders Use Relative Volume?
Relative volume is a great gauge to establish how “in-play” a particular stock is. A stock in-play is one that is highly active and has a higher probability chance to give an outsized move. If RVOL is less than 1, the stock is doing average or below average volume and is not in play. If RVOL is greater than 2, traders should be watching this stock for a potential entry. As mentioned earlier, RVOL is an incredibly strong tool for stock selection and filtering trading ideas.

A stock with an RVOL greater than 3 and a strong technical setup is a recipe for a high probability trade. New traders often overlook both volume and RVOL. It is important to understand this trading metric if you want to have long-term success as an active trader, and it’s even more important if you are a momentum trader.
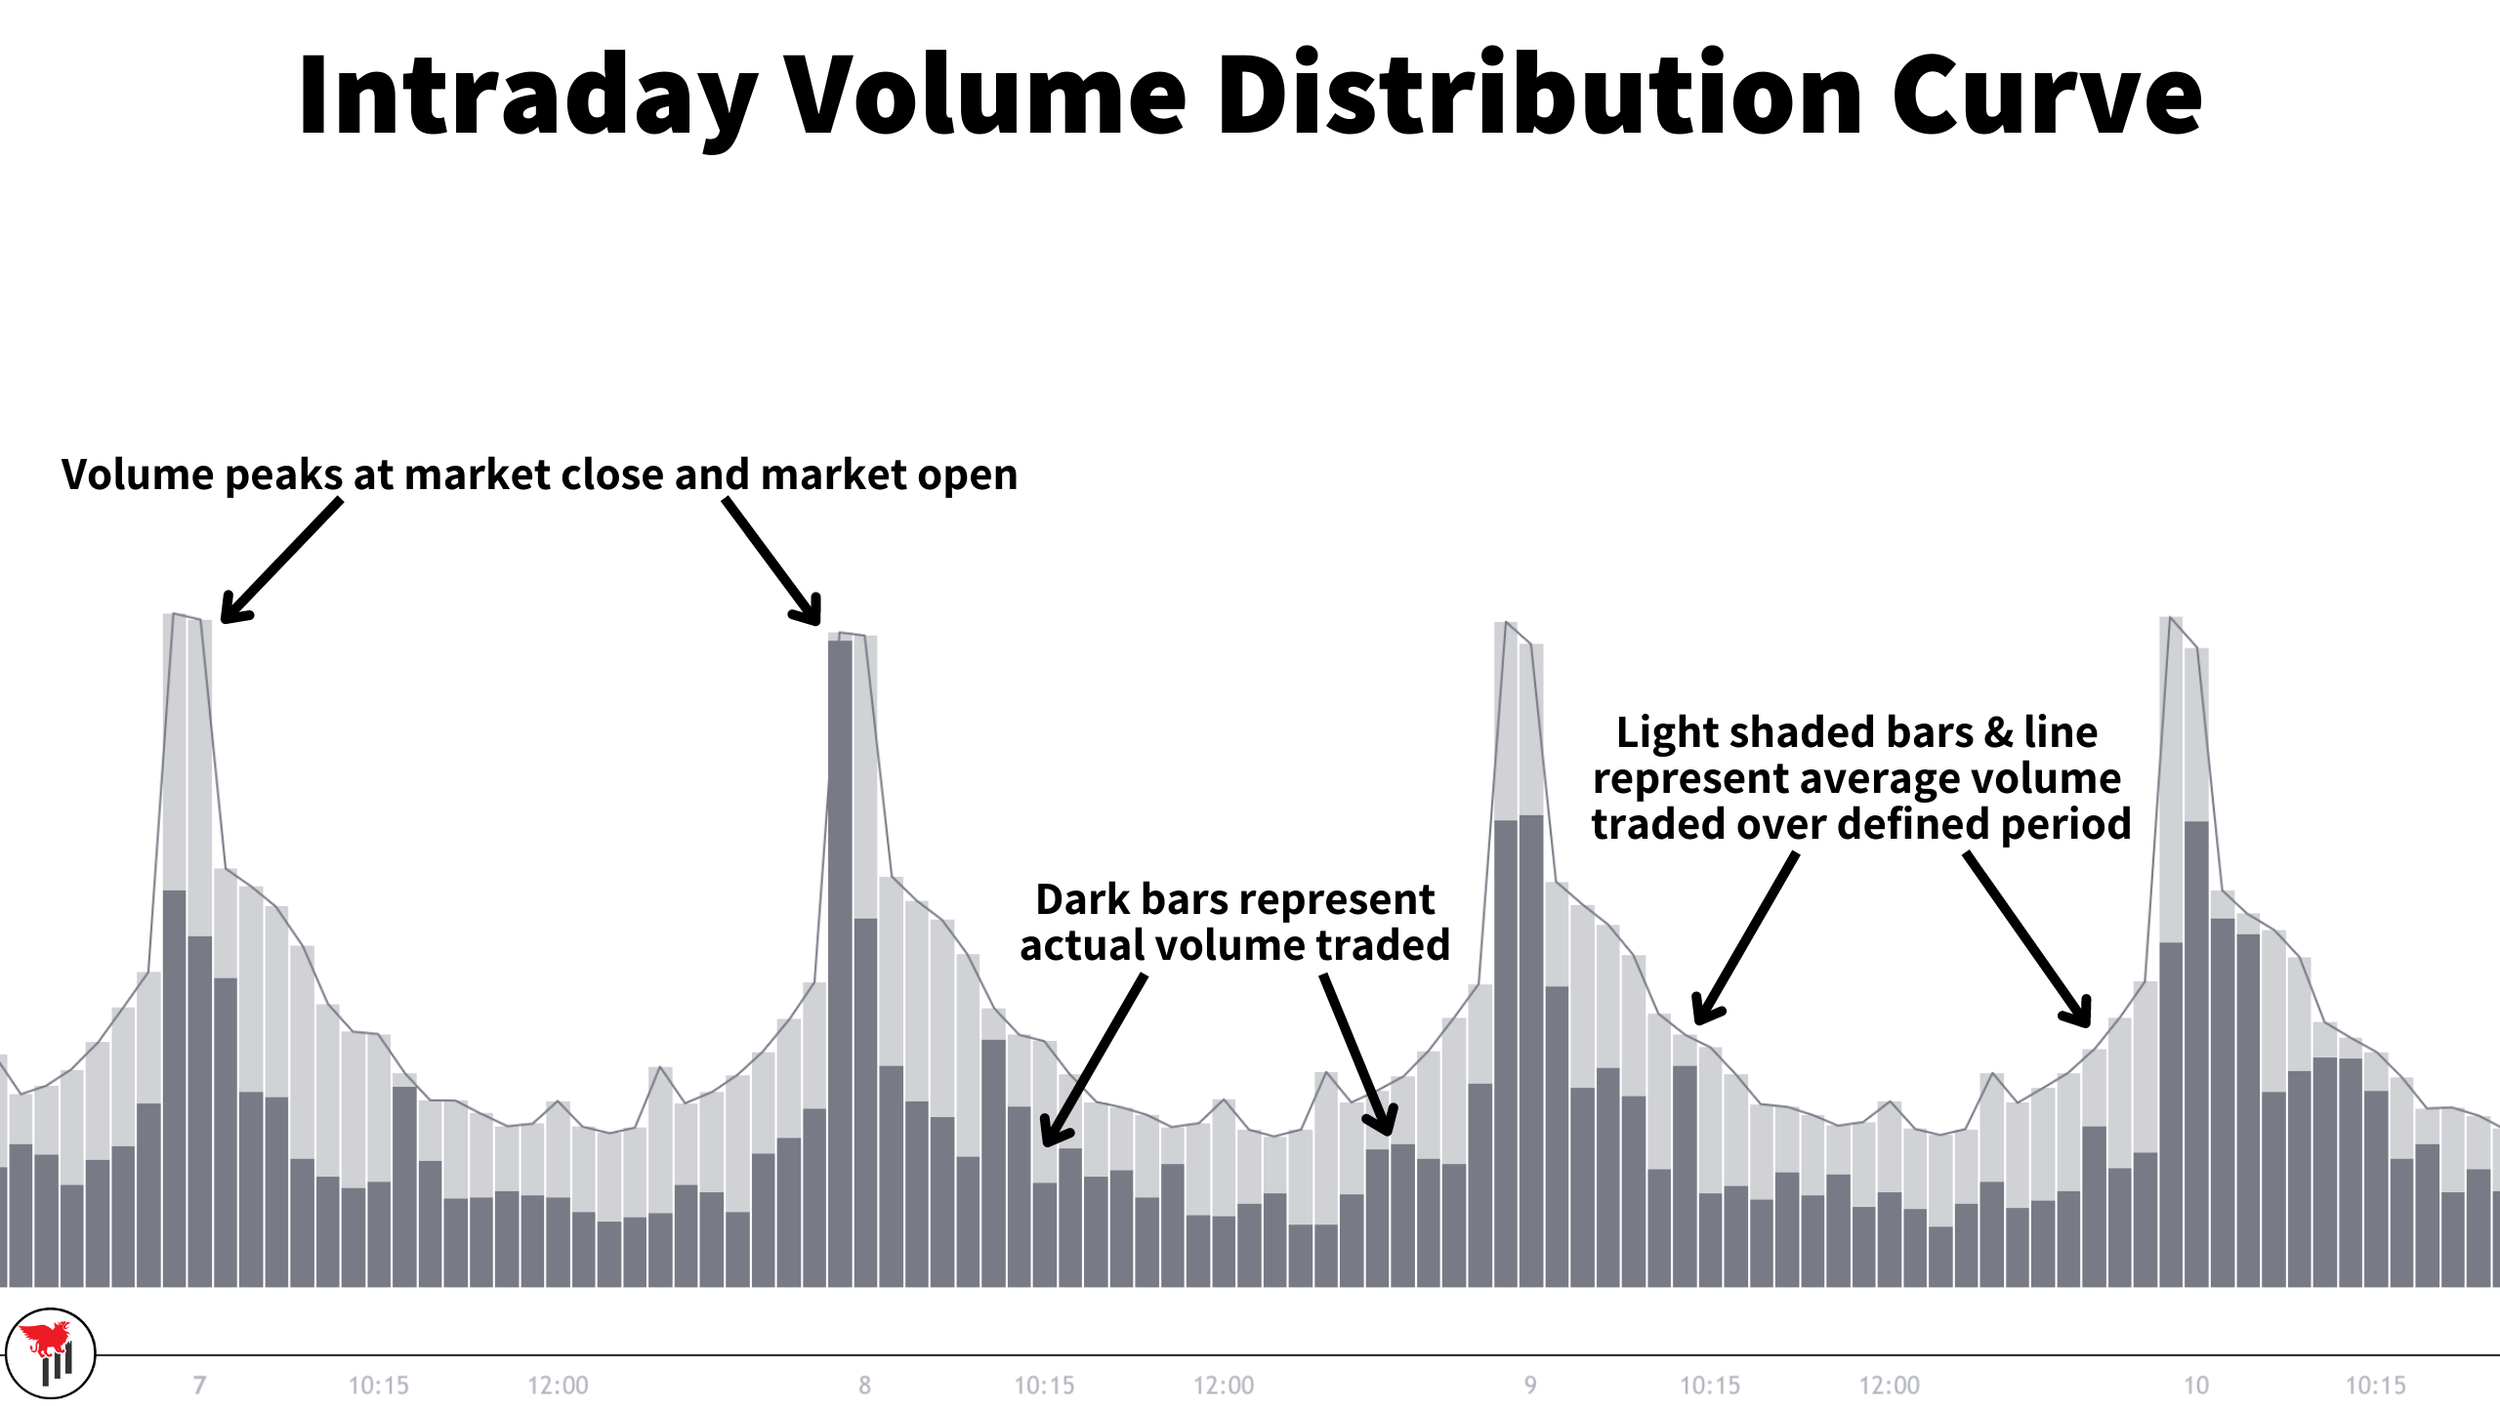
As mentioned previously, all stocks will follow their own intraday volume distribution curve - Generally speaking this looks like high volume at the open and close of the trading session, with a lull midday. When volume is pushing outside of that normal volume distribution curve, the stock is experiencing high volume. These are the moments where traders should be paying attention to a stock.
Imagine that a stock’s volume represents force. For a stock to move with momentum or beyond its normal average true range (ATR), the stock would need to have excessive force to overcome the “gravitational-pull” of it’s ATR. If the price exploration does not have force (volume), then the expectation is that price will be pulled back to the established range and trade sideways for the day.
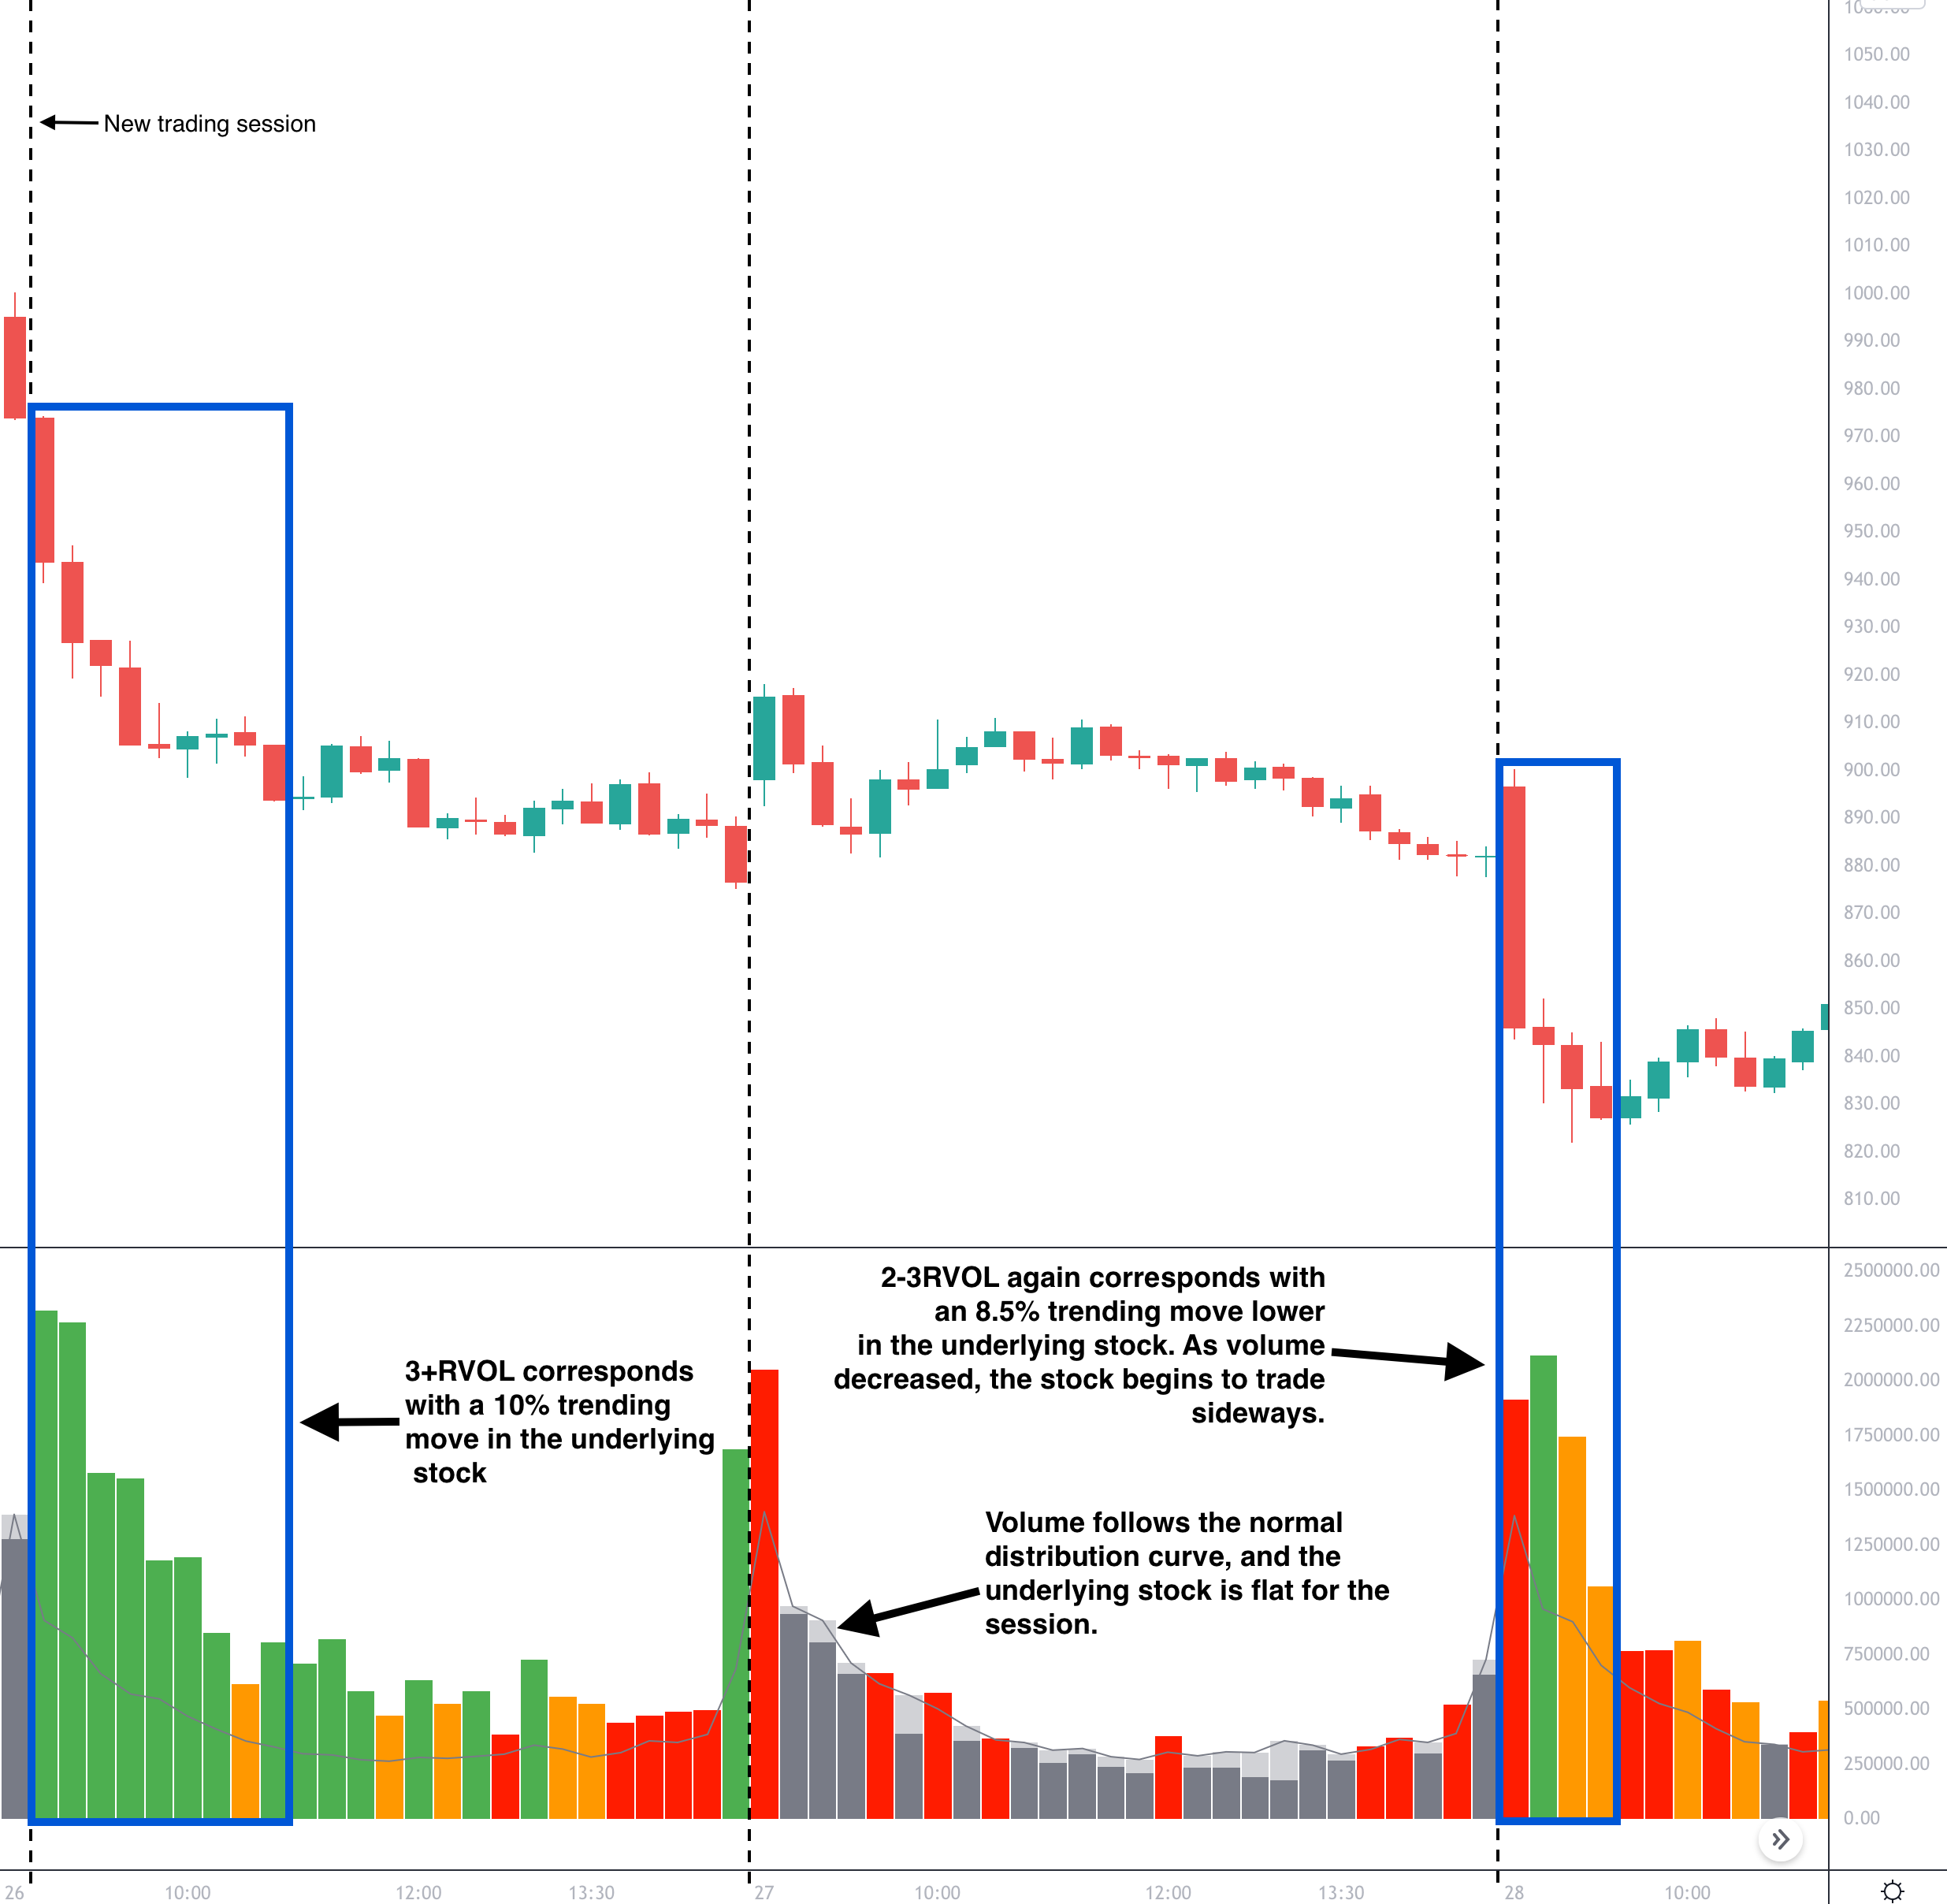
We can see this visualized in the chart below, showing two and a half trading sessions. In the first session, the stock is trading on 3RVOL early in the session, which was enough “force” to push the stock 10% lower. In the following session, the stock traded on average volume and you can see that it followed the normal volume distribution curve. The stock traded sideways for the entirety of the session, as there was not enough force to push it outside of its normal trading range. Finally on the third day, the stock was once again trading with 2-3RVOL and there was enough force to move the underlying another 8.5%. As volume began to decrease and start trading near the normal distribution curve, the underlying stock began to trade sideways.
How To Identify High Relative Volume in Stocks
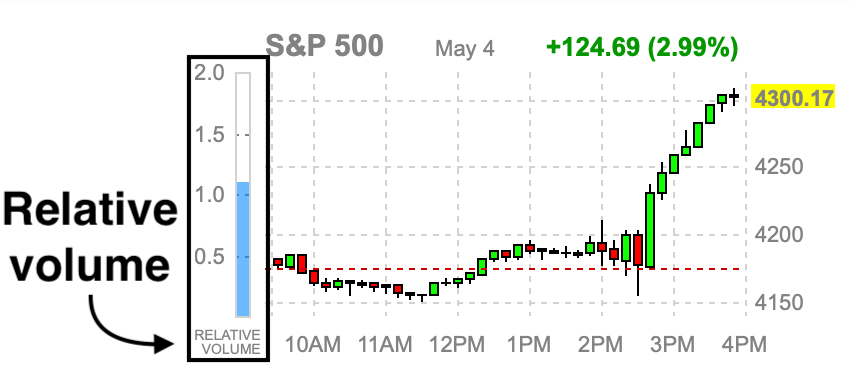
Unfortunately, most brokers do not offer volume data tools within their platform natively. This is part of the reason why we built and offered the ThinkOrSwim Volume Data Tool. There are also other free web-based tools that can be used, like the relative volume gauge found on Finviz. The main issue with relying on this is it’s not clear what their relative volume gauge is based on.
Fortunately, we have a relative volume tool available now for TradingView users, and will have an updated indicator in the near future for ThinkOrSwim users as well. One of the main advantages that the Opinicus Relative Volume data tool (for TradingView) offers users is time of day specific data. Not only will this volume indicator show you if the stock is doing high relative volume, but it will show you if it is doing high RVOL at that specific time of day, and to what degree. Relative volume at a specific time of day is perhaps the most valuable way for traders to visualize and understand volume.
The Opinicus Relative Volume data tool (for TradingView) utilizes a variety of color gradients to display the exact multiple of volume being done. For example, if the stock is doing average or below average volume, the color gradient would simply be gray. This can be seen in the prior examples. If a stock has 1-1.5 RVOL, the volume data tool will display a red bar. The tool will print different colored bars for 1.5-2 RVOL, 2-3 RVOL, and >3 RVOL.
This tool is available now and free to members of the Trader’s Thinktank or Options Mastery Course. If you are not a member, but would still like access to the tool, you can gain access by clicking here.