Opinicus Volume Data Tool - ThinkOrSwim Custom Script (ThinkScript)
DOWNLOAD YOUR VOLUME DATA SCRIPT BY CLICKING HERE
Volume is one of only two absolutes we have available to us in trading. Whether you are day trading or swing trading, volume is always an important consideration. We use it not only to confirm breakouts or breakdowns, but to show us where the “audience” is on the stocks throughout our watchlist. Larger audience equates to more activity and greater potential for move.
Unfortunately within TD Ameritrade’s ThinkOrSwim platform, there is no easy way to check the volume of a particular stock at a glance. To solve this inconvenience and allow us to process information more quickly, the Opinicus team has created a custom script (AKA ThinkScript) to process volume data and present it to us in an easy to read format.
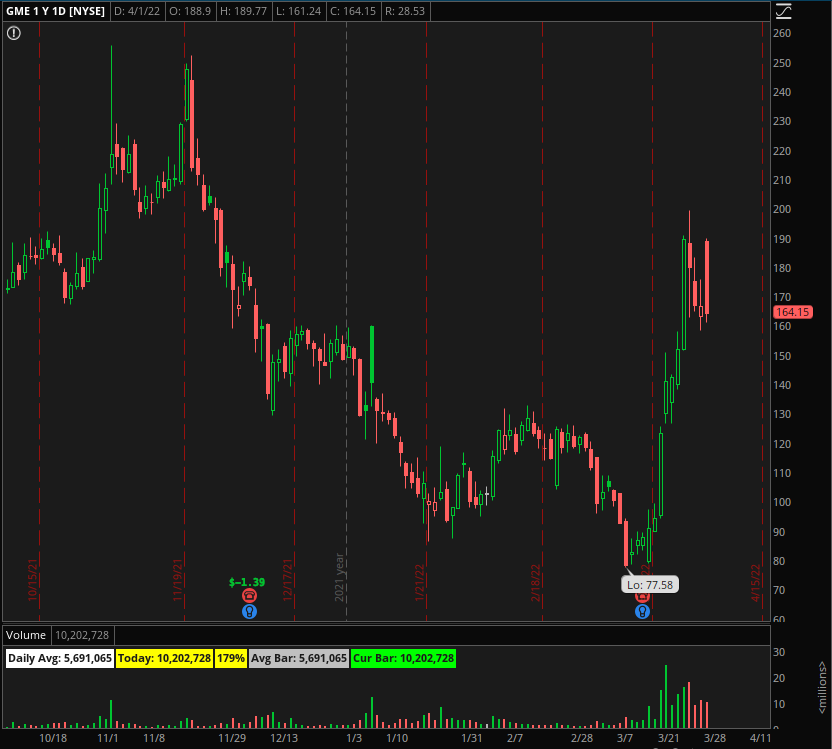
Figure 1 (above) shows what the Opinicus Volume Data script looks like once it is installed. There are five individual boxes with key information.
From left to right:
“Daily Avg” shows the daily average volume over the past 30 trading days.
“Today” shows the total volume for the current day
The percentage box shows current day’s volume as a percentage of daily average volume
“Avg Bar” shows the average volume of each volume bar for the currently selected timeframe
“Cur Bar” shows the volume of the current bar
This tool has been immensely helpful in my own personal trading as a means of quickly determining where the volume is when going through charts. Once reserved for members of the Opinicus Trader’s Thinktank team, we have elected to make it available to the public and give it away for free!
DOWNLOAD YOUR VOLUME DATA SCRIPT BY CLICKING HERE
Enjoy, and leave a comment below this article if you like it!

