
How to Trade with Supply and Demand Zones
One of the fundamental concepts that traders use to gain an edge in their trading strategies is the theory of supply and demand. In this article, we will delve into the intricacies of trading with supply and demand zones, exploring different formations, governing principles, and techniques to effectively utilize this concept for profitable trading. Whether you are a seasoned trader or just starting, mastering supply and demand zones can significantly enhance your trading edge. If you are familiar with support and resistance, then supply and demand will fit neatly with that knowledge. While the names are different, they are conceptually very similar.
Different Types of Supply and Demand Formations:
Supply and demand zones come in various shapes and sizes, and recognizing these formations is key to successful trading. Here are some common types:
Fresh Supply and Demand Zones
These zones form when price experiences a sharp reversal, often after a strong trend. Fresh supply zones indicate potential selling opportunities, while fresh demand zones signal potential buying opportunities. To buy a recent demand zone, watch for a break of the zone and then a retest. This presents a great asymmetrical opportunity for a trade.
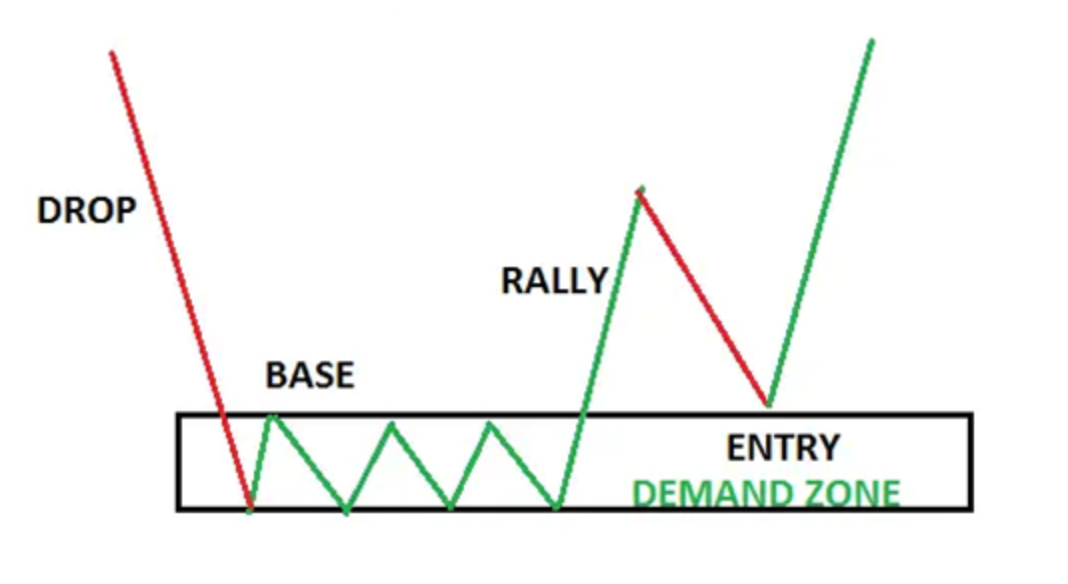
Drop Base Rally Demand Zone
Strong vs. Weak Zones
Strong zones have a history of multiple rejections, making them more significant. Weak zones, on the other hand, have seen fewer price interactions and may not be as reliable. As traders, we prefer to be focusing on the strongest zones. Strong zones have an emotional connection associated with that price point, so when price tests that area it will experience a quick move away from that spot.

Strong Versus Weak Supply and Demand Zones
Flip Zones
Sometimes, a previous supply zone can turn into a demand zone, and vice versa. These flip zones can provide excellent trade setups when recognized and begin to show how the market structure is taking shape. You may have heard that areas of support often become areas of resistance if price breaks below in a significant way. The same is true with supply and demand.

Areas of demand at 1 and 2 become areas of supply at 3 and 4
The Laws of Supply and Demand Trading
Supply and demand trading operates on the bedrock of fundamental principles that govern all financial markets. These laws are the cornerstones of successful trading, encompassing a simple understanding of market dynamics:
Zones as Support and Resistance
In the world of supply and demand trading, we view demand zones as support levels, preventing prices from falling further, and supply zones as resistance levels, halting upward price movement. These zones act as natural barriers, guiding price action and providing strategic entry and exit points for traders. As traders, we want to be buyers in areas of demand and sellers in areas of supply.
Price and Quantity Relationship
Central to this approach is the recognition that supply and demand zones form due to imbalances in buying and selling pressure. When demand overwhelms supply, prices rise, and when supply surpasses demand, prices fall. This essential relationship between price and quantity is pivotal for successful trading decisions. Once you understand this simple concept, you never have to search for what news or narrative is moving a stock or the index. Only price pays, so that is what we focus on.
These principles are the compass for traders navigating the intricate terrain of supply and demand zones. By grasping the interplay of support and resistance and understanding the critical connection between price and quantity, traders can make calculated decisions, increase their trading acumen, and improve their chances of success.
How to Tell When Supply and Demand Is Breaking
Identifying when supply and demand zones are weakening or breaking is crucial:
Zone Penetration
A breach of a supply zone indicates weakening demand, while a breach of a demand zone signals weakening supply. If you are looking for the safest possible trade, watch for a break of the zone and then a retest before taking an entry.
Volume Analysis
Declining volume near a zone can be a sign of weakening support or resistance. When a zone is tested, we want to see volume increasing as a sign that the zone is holding. If volume remains flat or low when testing a key zone, it is an indication that price will not reverse in the zone and the trend will continue. If you want to learn more about volume price analysis, we have a free resource available within the Trader’s Thinktank.
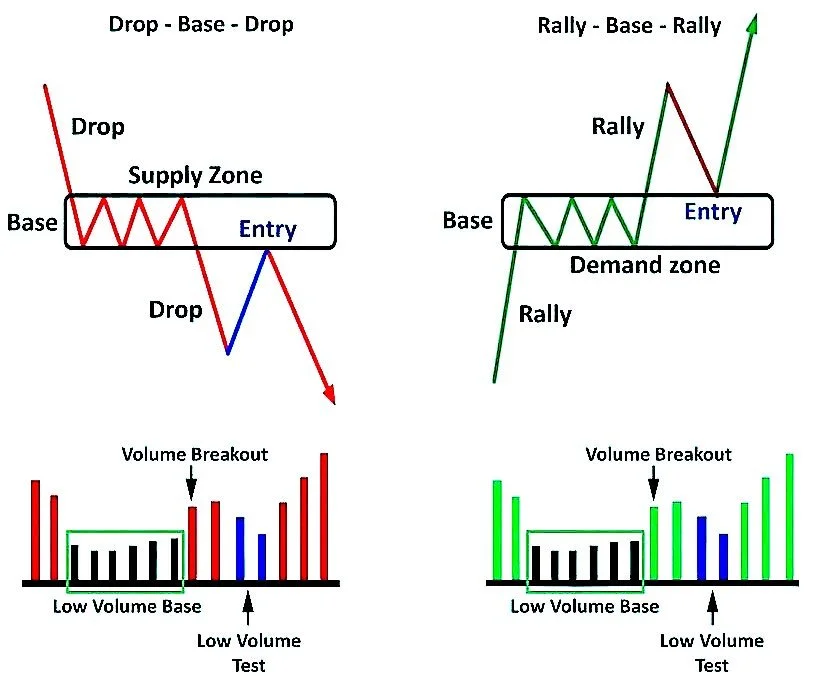
Volume analysis to help confirm supply and demand zones
Price Behavior
Watch for signs of price hesitating or slowing down near a zone. This can hint at a potential zone break. Depending on how price reacts to the zone on different timeframes can give clues about whether or not buyers or sellers remain in control of the tape.
How to Use the Concept of Supply and Demand Effectively for Trading Profits
To maximize profits, traders can combine supply and demand zones with other technical tools and strategies:
Confluence Factors
Look for additional confirmations such as dynamic support/resistance, trendline breaks, Fibonacci retracement levels, and price reversal candlestick patterns.
Multiple Time Frames
Check higher time frames to confirm the strength of supply and demand zones. If you are trading on the 2 minute or the 5 minute chart, double check that the zone is visible on the 15 minute, 30 minute, or 60 minute chart as well. This helps to verify the zone and can add conviction to your trade idea. As always, multiple timeframe analysis helps strength your edge.
Incorporating the principles mentioned in this article, we can further enhance our trading strategy. Look for recent swing highs and lows, areas with multiple rejections, zones that have acted as both support and resistance, and areas from where prices moved rapidly. While not all five conditions need to be met, the more conditions that align, the stronger the zone.
For additional confirmation, consider using dynamic support and resistance levels like MA/EMA 21, 50, 100, 200, trendline breaks, Fibonacci retracements to key levels, and price rejection/reversal candlestick patterns. Don't forget to validate your analysis with larger time frames (monthly, weekly, daily) to increase the reliability of your trading decisions.
Conclusion
Trading with supply and demand zones is a powerful strategy that can provide traders with a competitive edge in the financial markets. By understanding the different types of formations, adhering to the laws of supply and demand, recognizing when zones are breaking, and effectively using confluence factors, traders can make more informed and profitable trading decisions. Remember that mastering this strategy takes practice, but when applied correctly, it simplifies price action trading and can lead to consistent success in the markets. If you want to learn more about using supply and demand to improve your profitability, sign up for the Options Mastery Course.