Maximize Gains Utilizing Trading Ranges
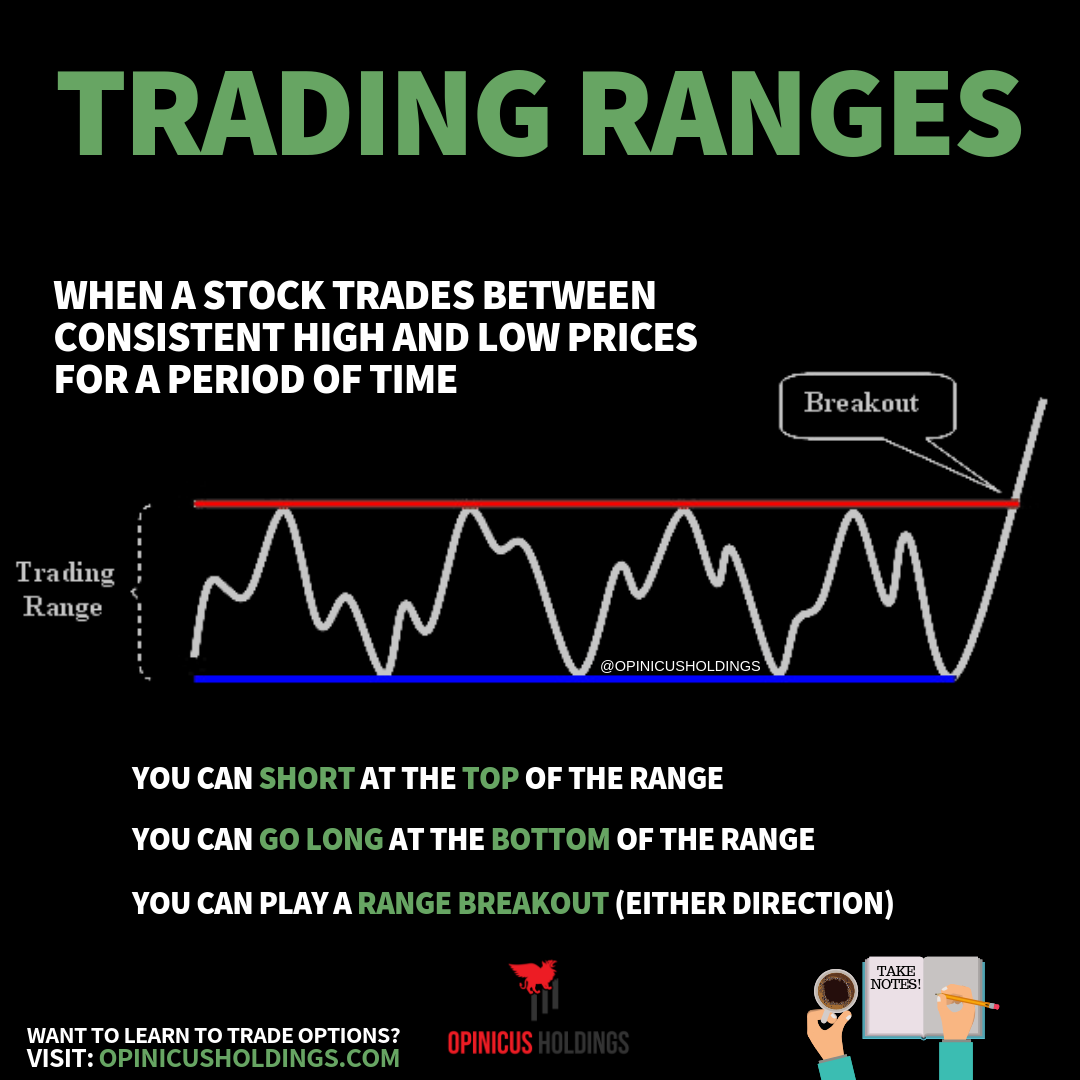
What are trading ranges? Ranges can be found when a stock maintains price movement between a support and resistance level for an extended period of time. To show this concept on a real chart, see figure 1 below.
Figure 1: $ATVI (1h chart) Trading range highlighted in the shaded white rectangle.
This trading range seen on $ATVI maintained a sideways move between the 46 price level (support) and the 47.5 price level (resistance). Setups like this can be highly lucrative to traders, particularly options traders. In this scenario we were using 5-10 days-till-expiry (DTE) positions with at the money (ATM) strikes. In this particular case of $ATVI, the price would generally move the span of the 1.5 point range within a single day. This is an additional bonus that adds to the favorability of this setup, because it enables to you lock in your profits prior to the session close, and then reevaluate the next day. Look for this kind of price action behavior when scanning for trading ranges.
Utilizing this technical pattern, we are able to take advantage of high-odds entry points. For example, we would purchase calls (“going long”) at any indication of a bounce off 46; and purchase puts (“going short”) at any indication of rejection at the 47.5 level. These levels provide clear and defined exits- you know exactly where you are wrong when playing a trading range. Simple setups like this provide you with an edge in the stock market!
Additionally, when price action does move outside of the range, you have another trade idea and potentially great entry to consider. Price action pushing outside of a trading range can be considered a “breakout” or “expansion.” While the next price target to take profits after a stock has broken out might not be as defined as it is within a trading range, you are still provided with a high-odds entry point. This was one of our best recurring trade plans that the Opinicus team utilized within the Trader’s Thinktank, both playing the rangebound action as well as the breakouts.
Trading ranges quick reference infographic.


