
Gamma & Gamma Exposure - What Traders Need to Know
EDITOR'S NOTE [April 2025]: While gamma exposure remains an interesting market concept that many traders follow, our trading community has evolved to focus on more reliable and practical trading approaches. This article provides educational background on gamma mechanics, but my current trading methodology emphasizes more consistent and practical strategies. See my note at the end about what we've found to be more effective for consistent profitability.
Gamma and Gamma Exposure (GEX) are becoming increasingly important forces in today’s market, and have the potential to become one of the most important non-fundamental flows in equity markets.
As traders, we are always interested in developing and understanding new and persistent market edges. When market participants are forced to buy or sell in a predictable fashion we get reliable behavior that can be exploited and that is unlikely to disappear.
One of these “hidden” market forces that has become increasingly stronger in recent years is option market makers gamma exposure.
Much like the increasing popularity and usefulness of options flow data and option sweeps as a source of edge, more and more option traders are becoming aware of and interested in the implications of option market makers gamma exposure.
Some may recall the Gamestop (GME) saga that took place earlier this year - Much of this bizarre and explosive move was attributed to GEX, which was a prime example of how the mechanics of gamma exposure can influence market action in a very powerful way.
We expect option-driven flows to continue to draw trader and investor attention in the coming weeks, months, and years, given the continued record-breaking activity seen in the options market. As Goldman points out, the options market is now doing volume that is a multiple of the underlying shares volume.
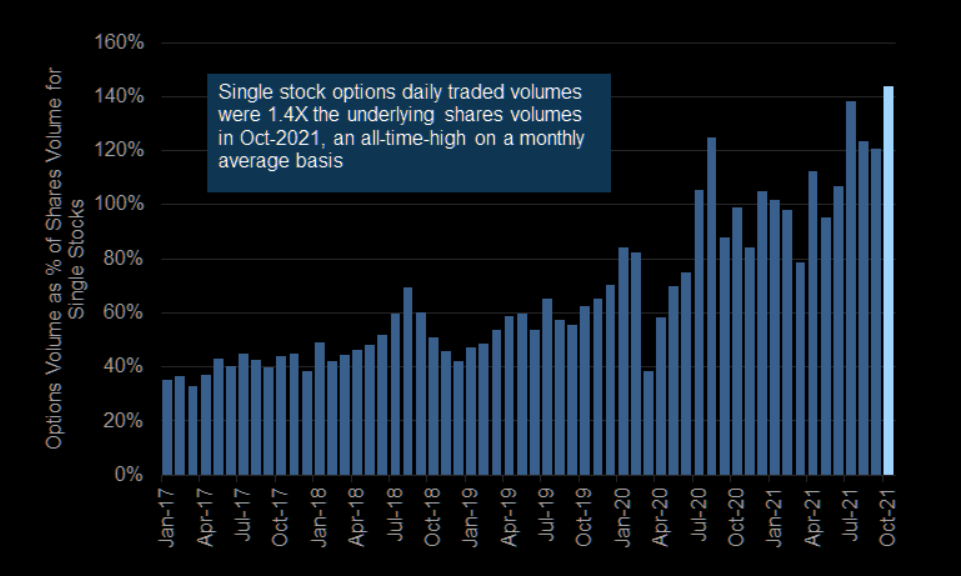
The options market is now 1.4x the underlying shares volume in Oct-2021
What Is Gamma?
Gamma is the first derivative of delta (with respect to underlying price). As option traders know, delta is an option's exposure to the underlying's moves. Because delta changes as the underlying spot price changes (out-of-the-money options become more sensitive to spot moves as they become closer to in-the-money). Gamma measures the rate of the change in delta as the underlying spot moves.
In simpler terms, gamma measures how much the delta of a given option is estimated to move should the underlying move up or down. In turn, this movement can lead market participants (usually market makers) to offset the change by trading the underlying shares.
Derivatives markets are zero-sum, meaning that each trader has a buyer and a seller. In a typical option trade, the trader is either buying or selling an option with the intention of holding that position, but the other side of the trade is a market maker who does not have an economic need for the option. As long as that market maker holds the position, they will try to minimize any market risk in the position, which is usually done by limiting exposure to the underlying market. To do that, the market maker will delta-hedge the option, by nearly continuously trading stock or futures in a way that keeps zero net exposure to the underlying.
When the price of a security changes, option market makers are forced to adjust their hedges by buying or selling the security underlying an option (e.g. a stock or an index future). This is because the price relationship (delta) between option and underlying constantly changes (gamma) and dealers (market-makers) must hedge these changes to avoid taking on directional market risks. This is also known as a delta-neutral strategy.
Dealer gamma exposure can be long or short (depending on options positioning in the market) with opposite effects amounting to billions of dollars of forced supply and demand.
Long Gamma
Dealers hedge by buying more with each point a security falls (and vice versa) and suppress volatility. Volatility is suppressed by this constant force of supply and demand counter to the market´s direction – this is what we often witness in the form of slowly rising markets or long sideways moves oscillating in a tight range around one price point. Price seems to be “pinned” to a certain level, also known as options pinning.
Short Gamma
Dealers hedge by selling more with each point a security falls (and vice versa) which naturally increases volatility – often leading to large directional moves.
As mentioned previously, gamma has the potential to be one of the most important non-fundamental flows in equity markets, particularly when short gamma causes volatility to accelerate. However, tracking gamma remains complex and dynamic.
Why Is Option Gamma Important?

This chart visualizes the direct causality between gamma exposure and subsequent price moves - SqueezeMetrics
Depending on the market environment, option market makers are exposed to gamma differently and will need to constantly adjust their hedging activity to control their risk – this creates very real buying or selling pressure in the market.
As Rocky Fishman (Goldman equity derivatives strategist) explains, “gamma is one of the larger sources of non-fundamental economic activity in global markets. Market makers who delta-hedge their option positions are economically driven to trade substantial amounts of underlying shares or futures, strictly as a result of the price of the underlying itself changing, not as a result of fundamental news and without regard to the liquidity available. As a result, gamma can cause markets to overreact to fundamental news (short gamma) or too under-react to fundamental news (long gamma).”
An awareness of this hidden market force can be an area that provides potential edge for traders looking for the change from a low volatility to a high volatility environment to adjust their trading and market exposure.
Gamma continues to show rising importance in the current landscape of markets, and is a metric that we track and discuss regularly in the Trader’s Thinktank. With the options market continuing to grow relative to the overall equities market, it is our view that this phenomenon is here to stay. As Goldman points out below, SPX options’ open interest continues to rise.
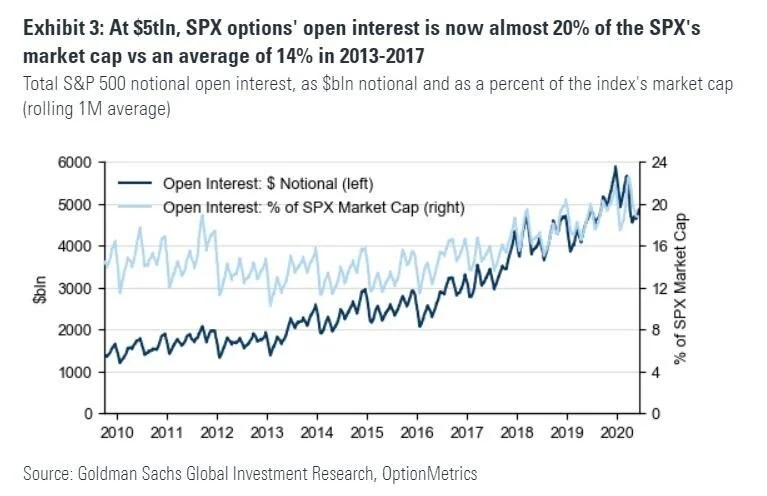
SPX Options’ Open Interest is now almost 20% of the SPX’s market cap.
That being said, recent headlines are usually overstating the impact gamma has on markets and individual names. Two of the chief reasons that gamma is frequently overstated by market participants and mainstream media outlets are:
Traders and investors are not exclusively long options - Selling (to open) put options and selling (to open) call options are both popular strategies that are widely deployed. These offset the flows of buying options.
Many option strategies are multi-leg - A put spread, for example, has two legs with partially offsetting gamma positions.
These two scenarios will hit the open interest tally, but will not have an impact on a dealer’s gamma exposure.
TRACKING GAMMA POSITIONING
Tracking gamma can be complex, and as of late, gamma overall seems to be over-sensationalized by mainstream media outlets. That being said, there are a few ways that traders and investors can create their own informed view on gamma positioning:
Open Interest - Gamma is most likely to have a real impact on the underlying when there is a higher than average amount of option open interest, and particularly when that open interest is short-dated and near-the-money.
Strike Distribution - Gamma is most likely to be relevant when open interest is concentrated in specific strikes, particularly near-the-money strikes.
WHERE TO LOOK FOR GAMMA’S IMPACT ON MARKET VOLATILITY

Monthly OpEx (vertical blue lines) can mark a turning point in SPY
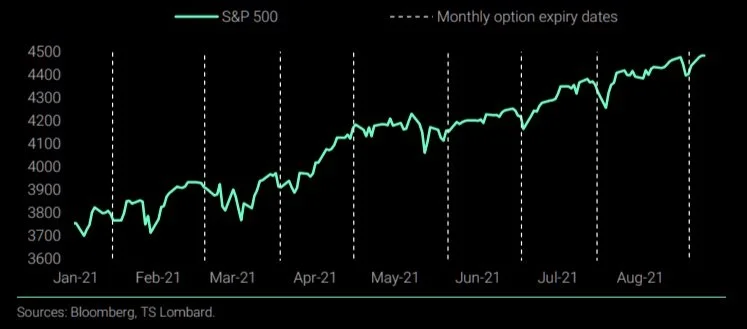
SPY dips have coincided with option expiries in recent months - Bloomberg
Gamma Unclenching
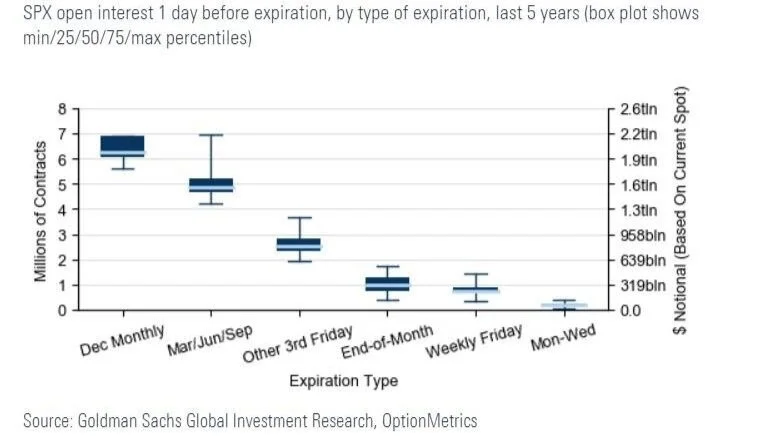
March, June, September and especially December tend to be “big” SPX expirations, with near $2T expiring on each.
Option expiration dates mark decisive points in the market, because gamma exposure that has built up over time often changes significantly overnight, which can lead to tradable breakouts.
When option contracts reach their maturity, dealer GEX is reduced and price action ceases to be pinned to the large gamma level. That being said, not all expirations are created equally.
SPX options are now listed with expirations every Monday, Wednesday, and Friday, so on the surface it can be surprising that activity is concentrated in certain expirations. However, for longer-dated options (generally beyond the nearest two months of expirations), options are only listed with either third Friday or end-of-month expirations. Quarterly (Mar/Jun/Sep/Dec) third Friday option expirations tend to be listed even farther in the future than other dates, and also have the advantage of having futures contracts with the same expiration. December options are listed even further out than other quarterlies. Because they are listed for so long, quarterly (specifically December) expirations are usually huge and can often build up to around $2T of open interest, per Goldman (graphic above).
The "cleaning up" (or, unclenching) of this positioning can in itself be a catalyst for heightened trader and investor activity as market participants realign portfolios for the following weeks and months. As mentioned, gamma can have a pinning effect on the underlying which becomes more prevalent into OpEx. When gamma rolls off following the option’s expiration, dealers can unload their hedges which will usually open up a “volatility window” in the underlying.
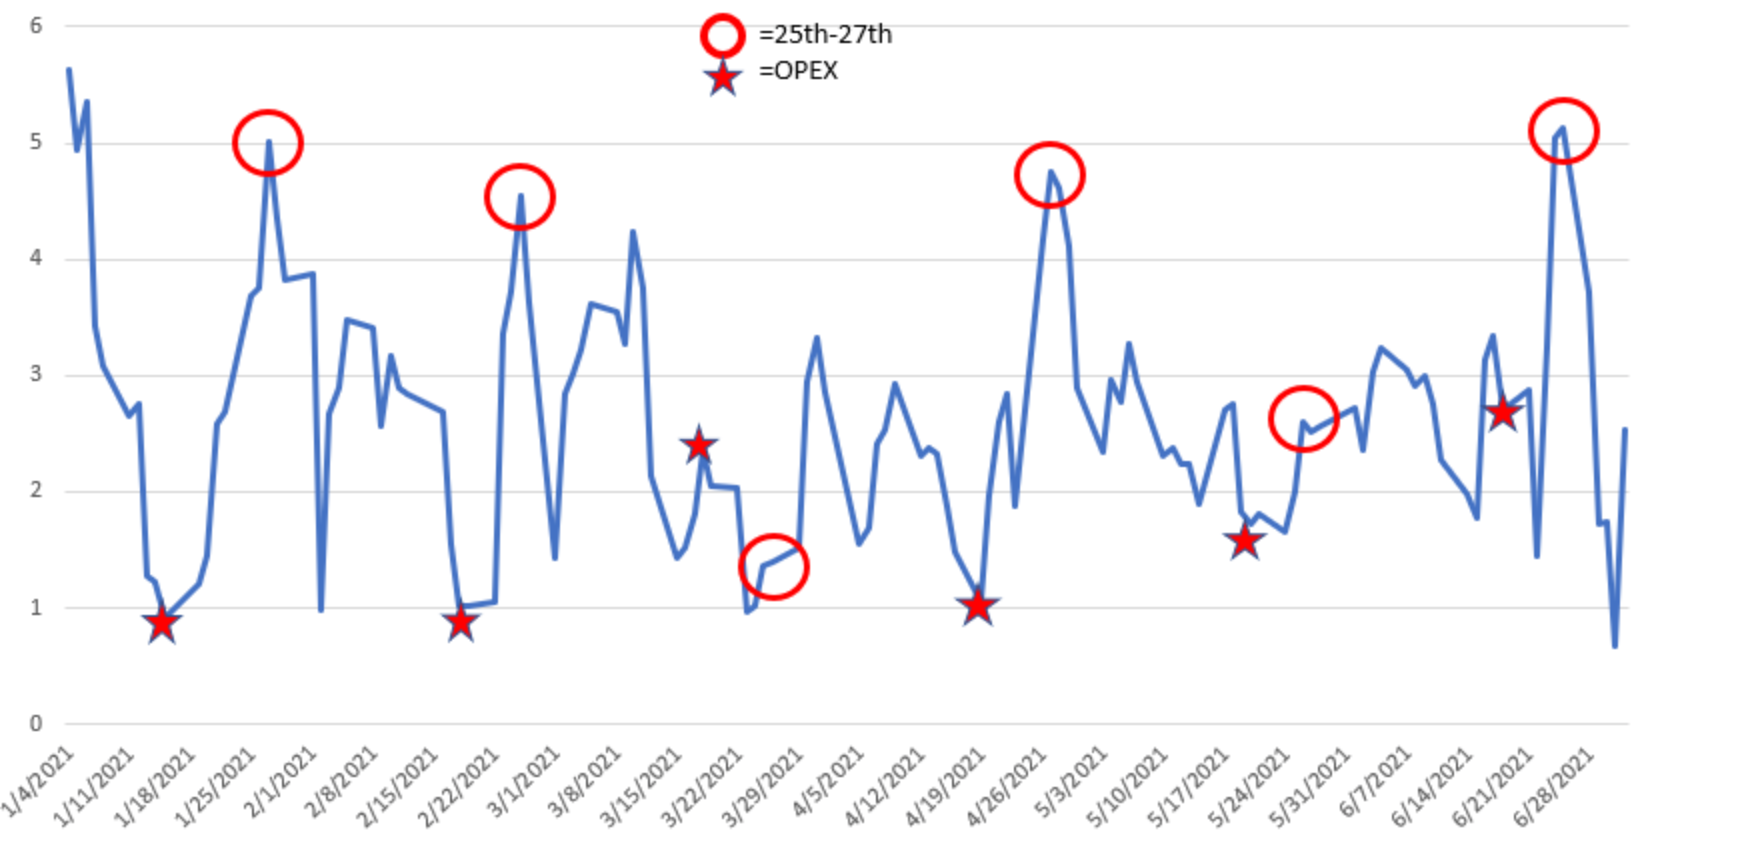
SPY Intraday Volatility vs OpEx - SpotGamma
In the graphic above, a higher reading indicators the markets are having larger swings on the day, and a low reading indicates a tight intraday range. As shown in the graphic, most OpEx days correspond with relatively low volatility. Following OpEx, markets tend to experience periods of higher volatility which is a reaction to the gamma rolloff and hedging associated with dealer gamma exposure.
Beyond Gamma: What Actually Works for Consistent Trading
Since writing this article in 2021, my trading focus and our community's approach has evolved significantly. While understanding market mechanics like gamma exposure provides valuable background knowledge, we've found more consistent results by focusing on tradable price action, risk management, and systematic approaches to market analysis.
In our daily livestreams and mentorship programs, we emphasize practical, repeatable trading methodologies that don't rely on trying to predict gamma-driven moves. The reality is that while gamma exposure can occasionally create interesting market conditions, building your trading approach around it tends to be less reliable than focusing on price action, market structure, and proper position sizing.
If you're interested in gamma exposure, you likely appreciate understanding market structure and looking beyond basic technical analysis. This deeper market understanding is exactly what we cultivate in our trading community - but with approaches that have proven more reliable for consistent profitability.
What we've discovered is that traders who succeed long-term focus less on predicting market forces like gamma exposure and more on responding to actual price action with proper risk management. Our community has evolved to emphasize these practical skills while maintaining a sophisticated understanding of what drives markets.
Ready to Move Beyond Theory to Actionable Trading?
If you're ready to transition from understanding theoretical market forces to implementing actionable trading approaches, I invite you to:
→ Join our Active Trader Community: Participate in daily livestreams where we analyze current market conditions and identify high-probability trading opportunities based on price action and market structure. Learn More
→ Explore Our Mentorship Programs: Develop a structured, repeatable trading process through personalized guidance and hands-on training in our group mentorship program or one-on-one coaching. Explore Mentorship Options
Ready to see these principles in action? Join our next livestream tomorrow at 9:30 AM ET.
Related Reading: Practical Trading Approaches
If you found this article interesting, you might benefit from these resources that focus on the trading methodologies we currently emphasize: