Fair Value Gaps: Is this ICT Concept Something New?
In the realm of technical analysis, traders often look for price inefficiencies to spot potential trade setups. Two popular methods for identifying these areas are ICT's Fair Value Gap (FVG) and Low Volume Nodes (LVNs), concepts that share significant similarities. Though FVGs are frequently touted as a unique approach to market imbalances, they are largely inspired by Peter Steidlmayer’s pioneering work with the Value Area and LVNs within the Market Profile framework. This article explores how FVGs and LVNs align in their principles, helping traders recognize that FVGs are part of a well-established tradition in price and volume analysis.
Understanding ICT's Fair Value Gap (FVG)
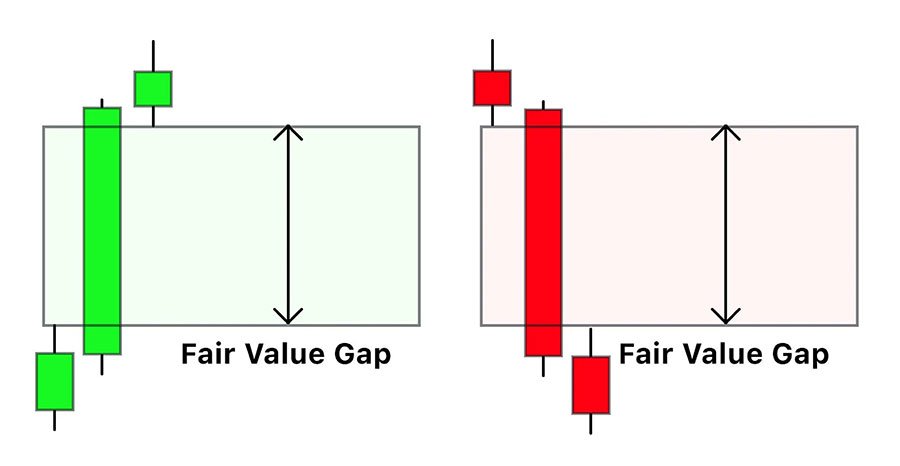
ICT's Fair Value Gap (FVG) identifies gaps between consecutive candles on a price chart. This gap appears when there is a sharp, directional price movement, leaving a visible gap between the high and low of the surrounding candles. FVGs signal areas of “inefficiency” or imbalance in the market, suggesting that price may revisit this zone to “fill the gap” and rebalance. This approach, widely adopted by traders looking for high-probability reversion zones, aims to capture moves as price returns to what’s perceived as fair value.
Exploring Low Volume Nodes (LVNs)
Low Volume Nodes (LVNs) represent areas on the chart where trading activity is minimal, identified through volume profile analysis. When price moves quickly through a region without much back-and-forth activity, an LVN is created, indicating that participants were less interested in trading in this zone. As a part of the broader Value Area concept introduced by Peter Steidlmayer, LVNs offer insights into market balance and imbalance. Traders view LVNs as zones that price may later return to, either to continue or reverse, depending on the market context.
FVG and LVNs: A Comparison
When examining FVGs alongside LVNs, it becomes clear that these two concepts share more than just a focus on market imbalance:
Zones of Imbalance: Both FVGs and LVNs are rooted in the idea of price imbalance. An FVG highlights where price moved rapidly, leaving a visible gap on the chart, while an LVN represents an area of low trading volume. Both are indications that price moved too swiftly through the area without establishing equilibrium.
Reversion Tendencies: In both cases, traders expect price to revert to these levels at some point. An FVG often signals a gap that the market might revisit, while an LVN suggests an area that price may test or fill as it moves back toward high-volume, balanced areas. This reversion tendency is a core component of each concept’s utility in market analysis.
Strategic Entry Points: Both FVGs and LVNs serve as zones where traders may find advantageous entry or exit points. When price revisits an FVG, traders look for signs of continuation or reversal within the broader trend. Similarly, when price approaches an LVN, traders anticipate potential reactions due to the volume gap in that area, using these nodes as markers for strategic trading decisions.
Recognizing FVGs as Part of a Well-Established Framework
While ICT’s Fair Value Gap has gained recent attention, it’s essential to understand that this concept is deeply connected to the foundational work established by Peter Steidlmayer. The notion of imbalances, whether represented by a gap in price (FVG) or low trading volume (LVN), has been a part of technical analysis for decades. By applying these principles in a fresh format, FVGs simply highlight a classic price action phenomenon that has long been understood and applied through Steidlmayer’s work on volume and market profiling.
Conclusion
In trading, fresh perspectives can breathe new life into established methods, but it’s crucial to recognize the continuity of these foundational concepts. The comparison between ICT’s Fair Value Gap and Steidlmayer’s Low Volume Node illustrates that many so-called “new” approaches often have roots in well-established theories. For traders interested in expanding their knowledge on these areas, examining both FVGs and LVNs within the context of market imbalance can offer invaluable insights. To gain a deeper understanding of volume and market profiling, consider reading our in-depth article, Mastering Volume Profiles: A Guide for Traders. Whether you’re studying FVGs, LVNs, or broader market balance concepts, these tools provide powerful ways to make informed trading decisions rooted in time-tested principles.


