
Mastering Volume Profiles: A Guide for Traders
To enhance your trading performance, it is crucial to grasp and implement volume profiles. This is one of the easiest tools to master and can have a great improvement on your edge. Long-time readers of our newsletter and this site, as well as members of the Trader’s Thinktank know that I am a big proponent of a simple approach to trading, with a primary focus on price and volume. Volume profile is another way to visualize how market participants are interacting with the price. After coaching numerous traders over nearly a decade in the trading industry, a common pitfall among unprofitable traders has become evident—they often dive into trading setups and patterns without considering the broader context. Trading without context isn't a strategy; it's simply trading patterns.
A successful trading strategy should not only define your edge but also specify the context in which you'll execute that edge. This is where analysis techniques like multiple timeframe analysis and tools such as volume profiles come into play.
Volume profiles form a fundamental component of many successful strategies, particularly for those focusing on index products like SPY, ES, or QQQ and NQ. By the end of this guide, you'll have a solid understanding of how to leverage volume profiles effectively.
WHAT IS A VOLUME PROFILE?
A Volume Profile serves as an advanced charting indicator, revealing the total volume traded at each price level over a specified time period.
Here's how volume profiles can benefit your trading:
Identify Key Support and Resistance Levels for Setups
Determine Logical Take Profits and Stop Losses
Calculate the Initial R Multiplier
Identify Balanced vs. Imbalanced Markets
Determine the Strength of Trends
Now, let's delve into the essential components of a volume profile:
VOLUME PROFILE COMPONENTS
Open, High, Low, & Close (OHLC): Fundamental components in various volume profile indicators.
Volume Point of Control (VPOC): The price level where the most volume was traded during a session, acting as a crucial reference point.
Value Area (VA): Represents the price range where a user-specified percentage of volume was traded for a session.
High Volume Node (HVN): Areas with high volume relative to the surrounding price action.
Low Volume Node (LVN): Areas with low volume relative to the surrounding price action.
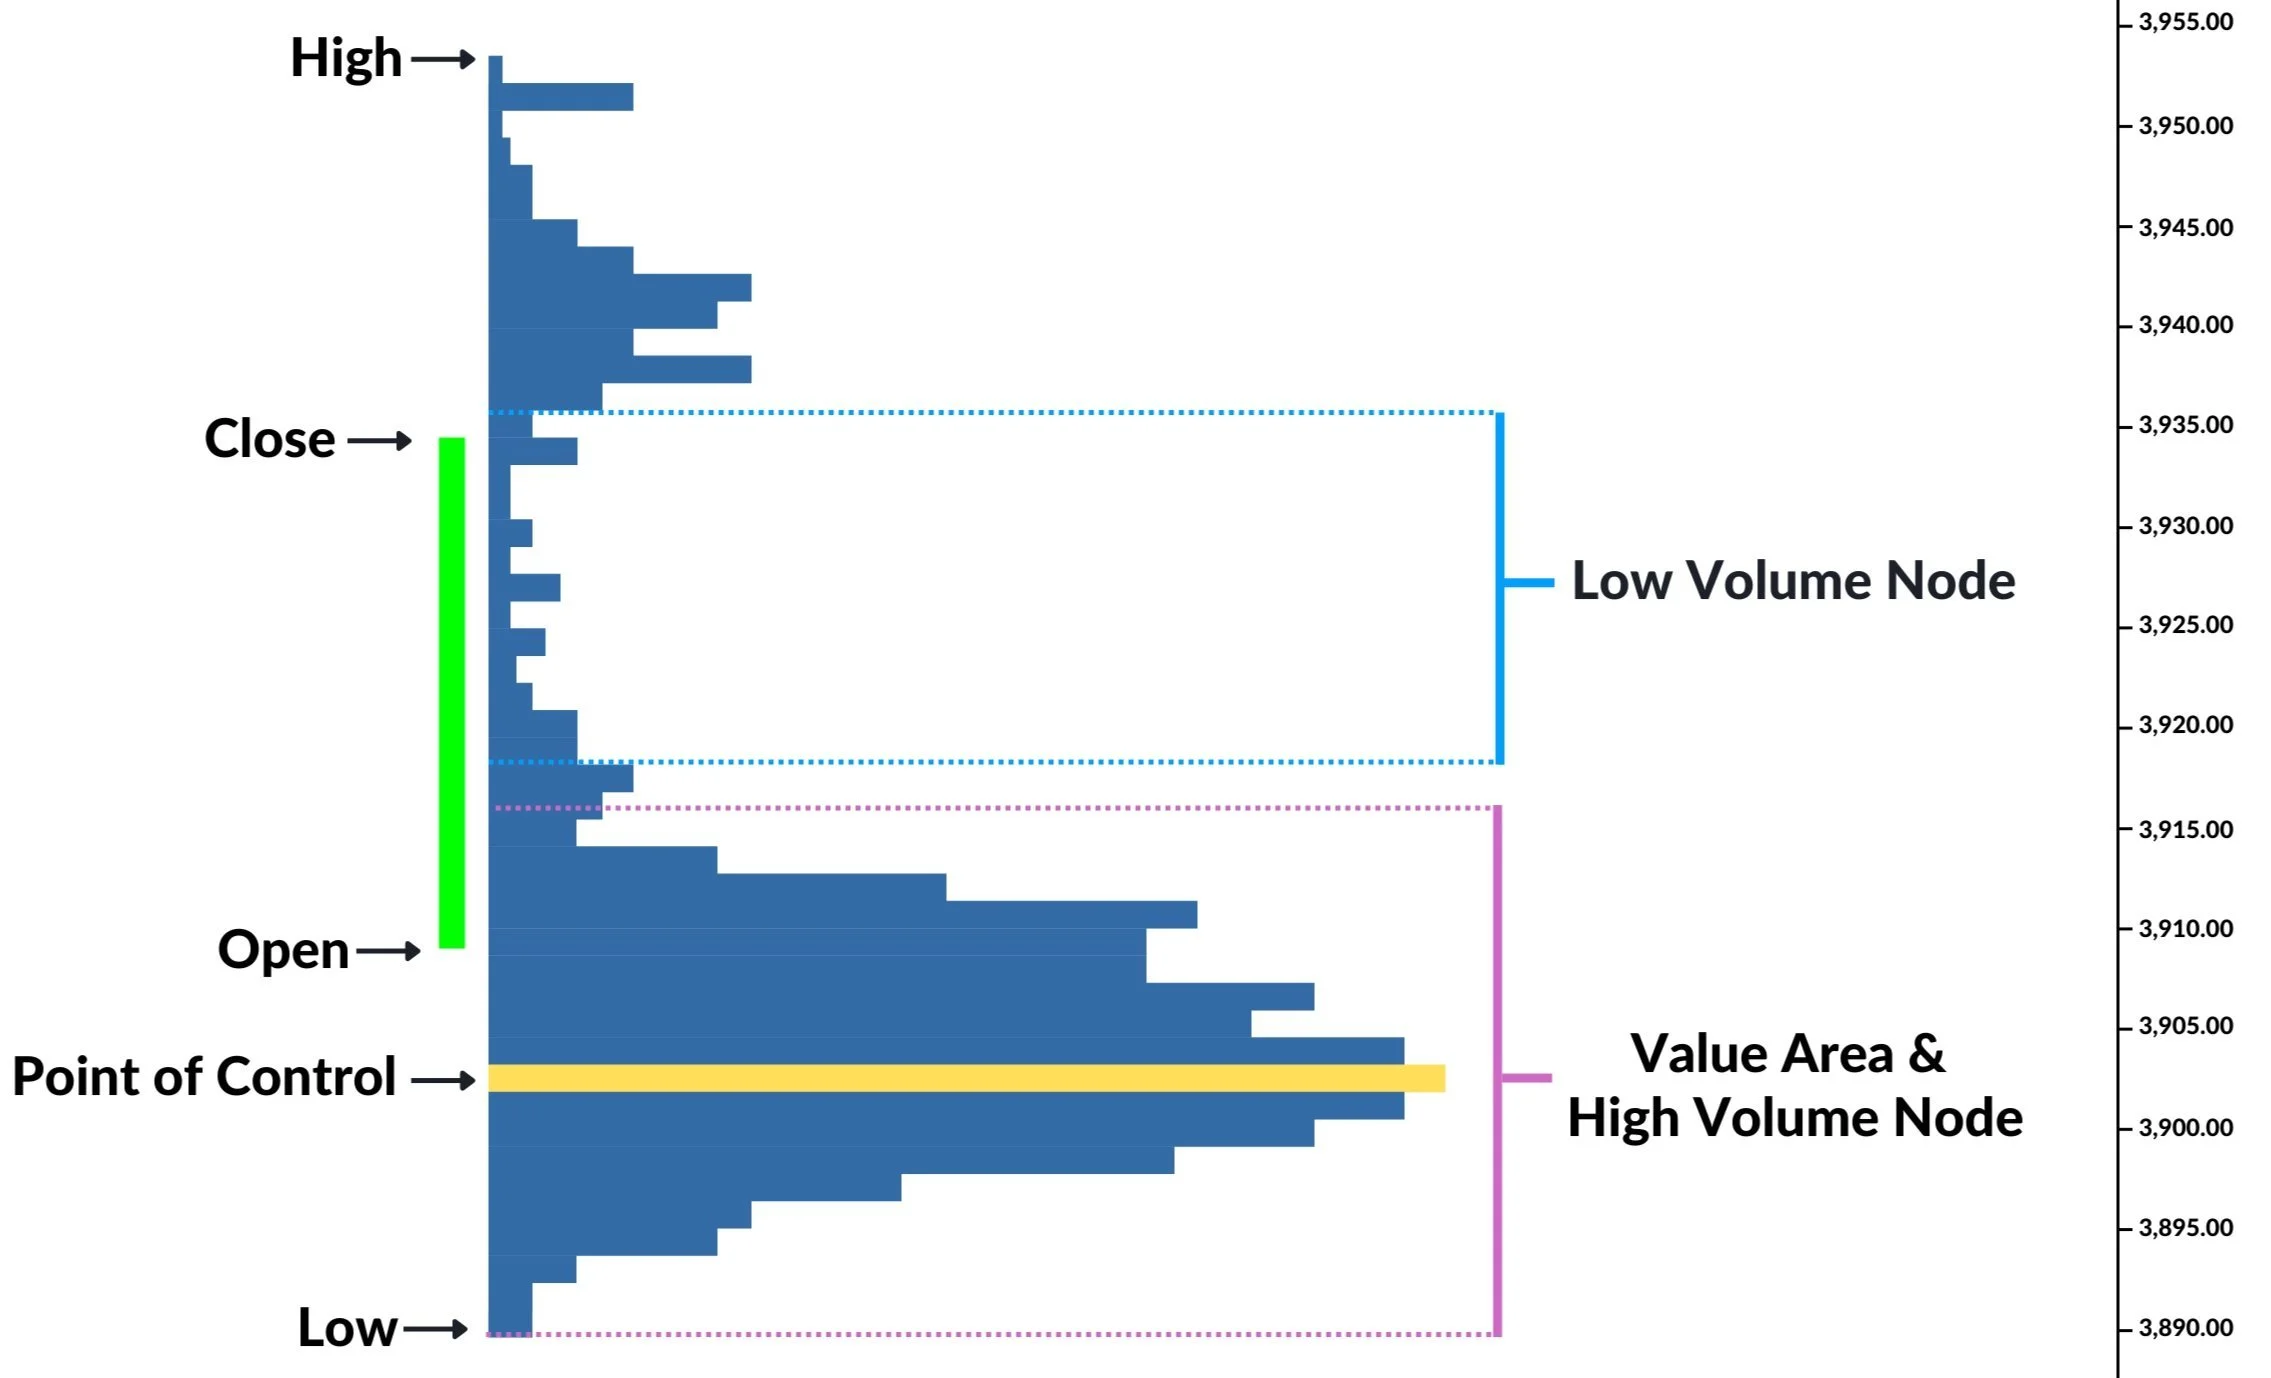
Volume Profile Overview
Analyzing price in relation to POCs, HVNs, and LVNs is crucial for building context around your trades. HVNs act like magnets, attracting and holding price, while LVNs are low-liquidity zones where price tends to pass through quickly.
VOLUME PROFILE INDICATORS
Volume profiles can be configured in various ways, depending on the indicator and charting software you use. Let's explore different indicators and their best applications:
X-axis Volume: Traditional representation of volume on the x-axis, showing volume through time.
Session Profile: Displays traded volume at each price level for a user-defined session.
Candlestick Volume Profile: Combines candlestick charts with volume profiles, providing insights for both long-term and short-term trading. Personally, in experimenting with these, I found them to be a bit too noisy for my liking.
VOLUME PROFILE STRATEGIES
To improve your trading performance, consider the following strategies:
HIGH VOLUME NODE (HVN) RETRACEMENTS
Look for trading setups near HVNs, as price tends to retrace to these levels.
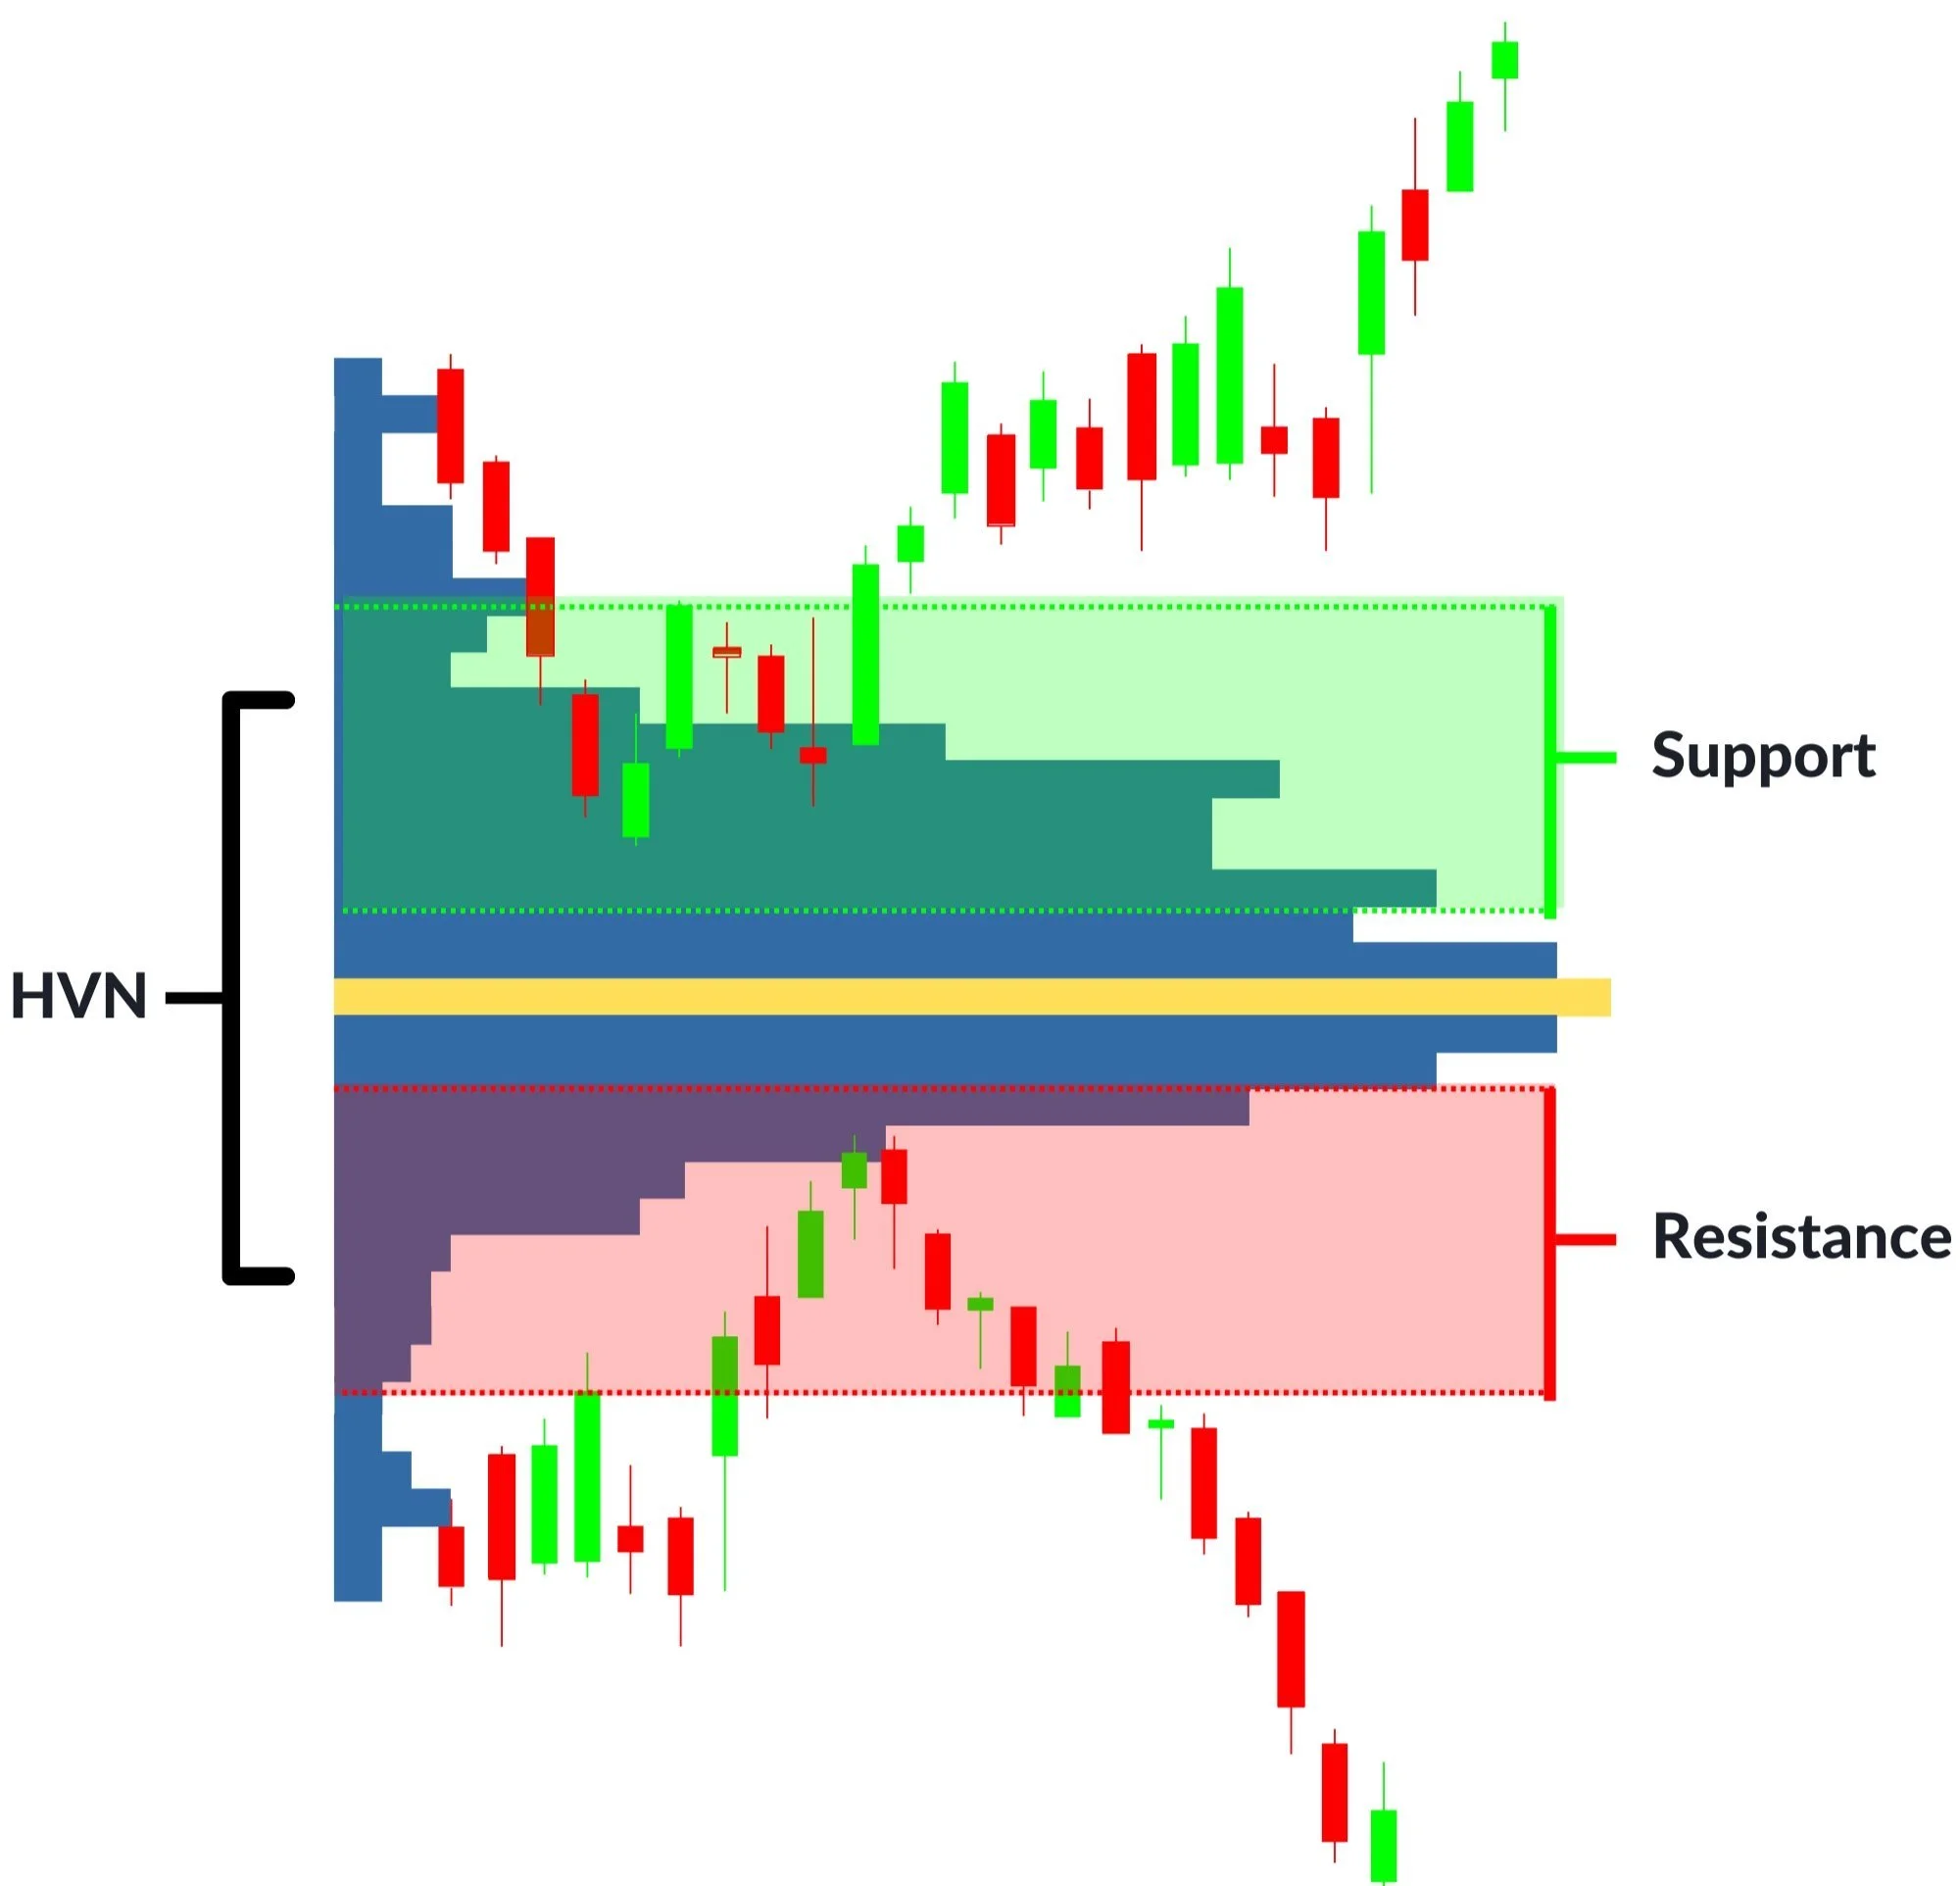
High Volume Node (HVN) Retracement
LOW VOLUME NODE (LVN) BREAKOUTS
LVNs are low-liquidity zones, ideal for breakout strategies when price makes decisive moves through them. If you are in the Trader’s Thinktank, you will hear me frequently talking about these concepts - Low-volume nodes on higher timeframe charts can provide big moves. As a momentum trader, this is important information.
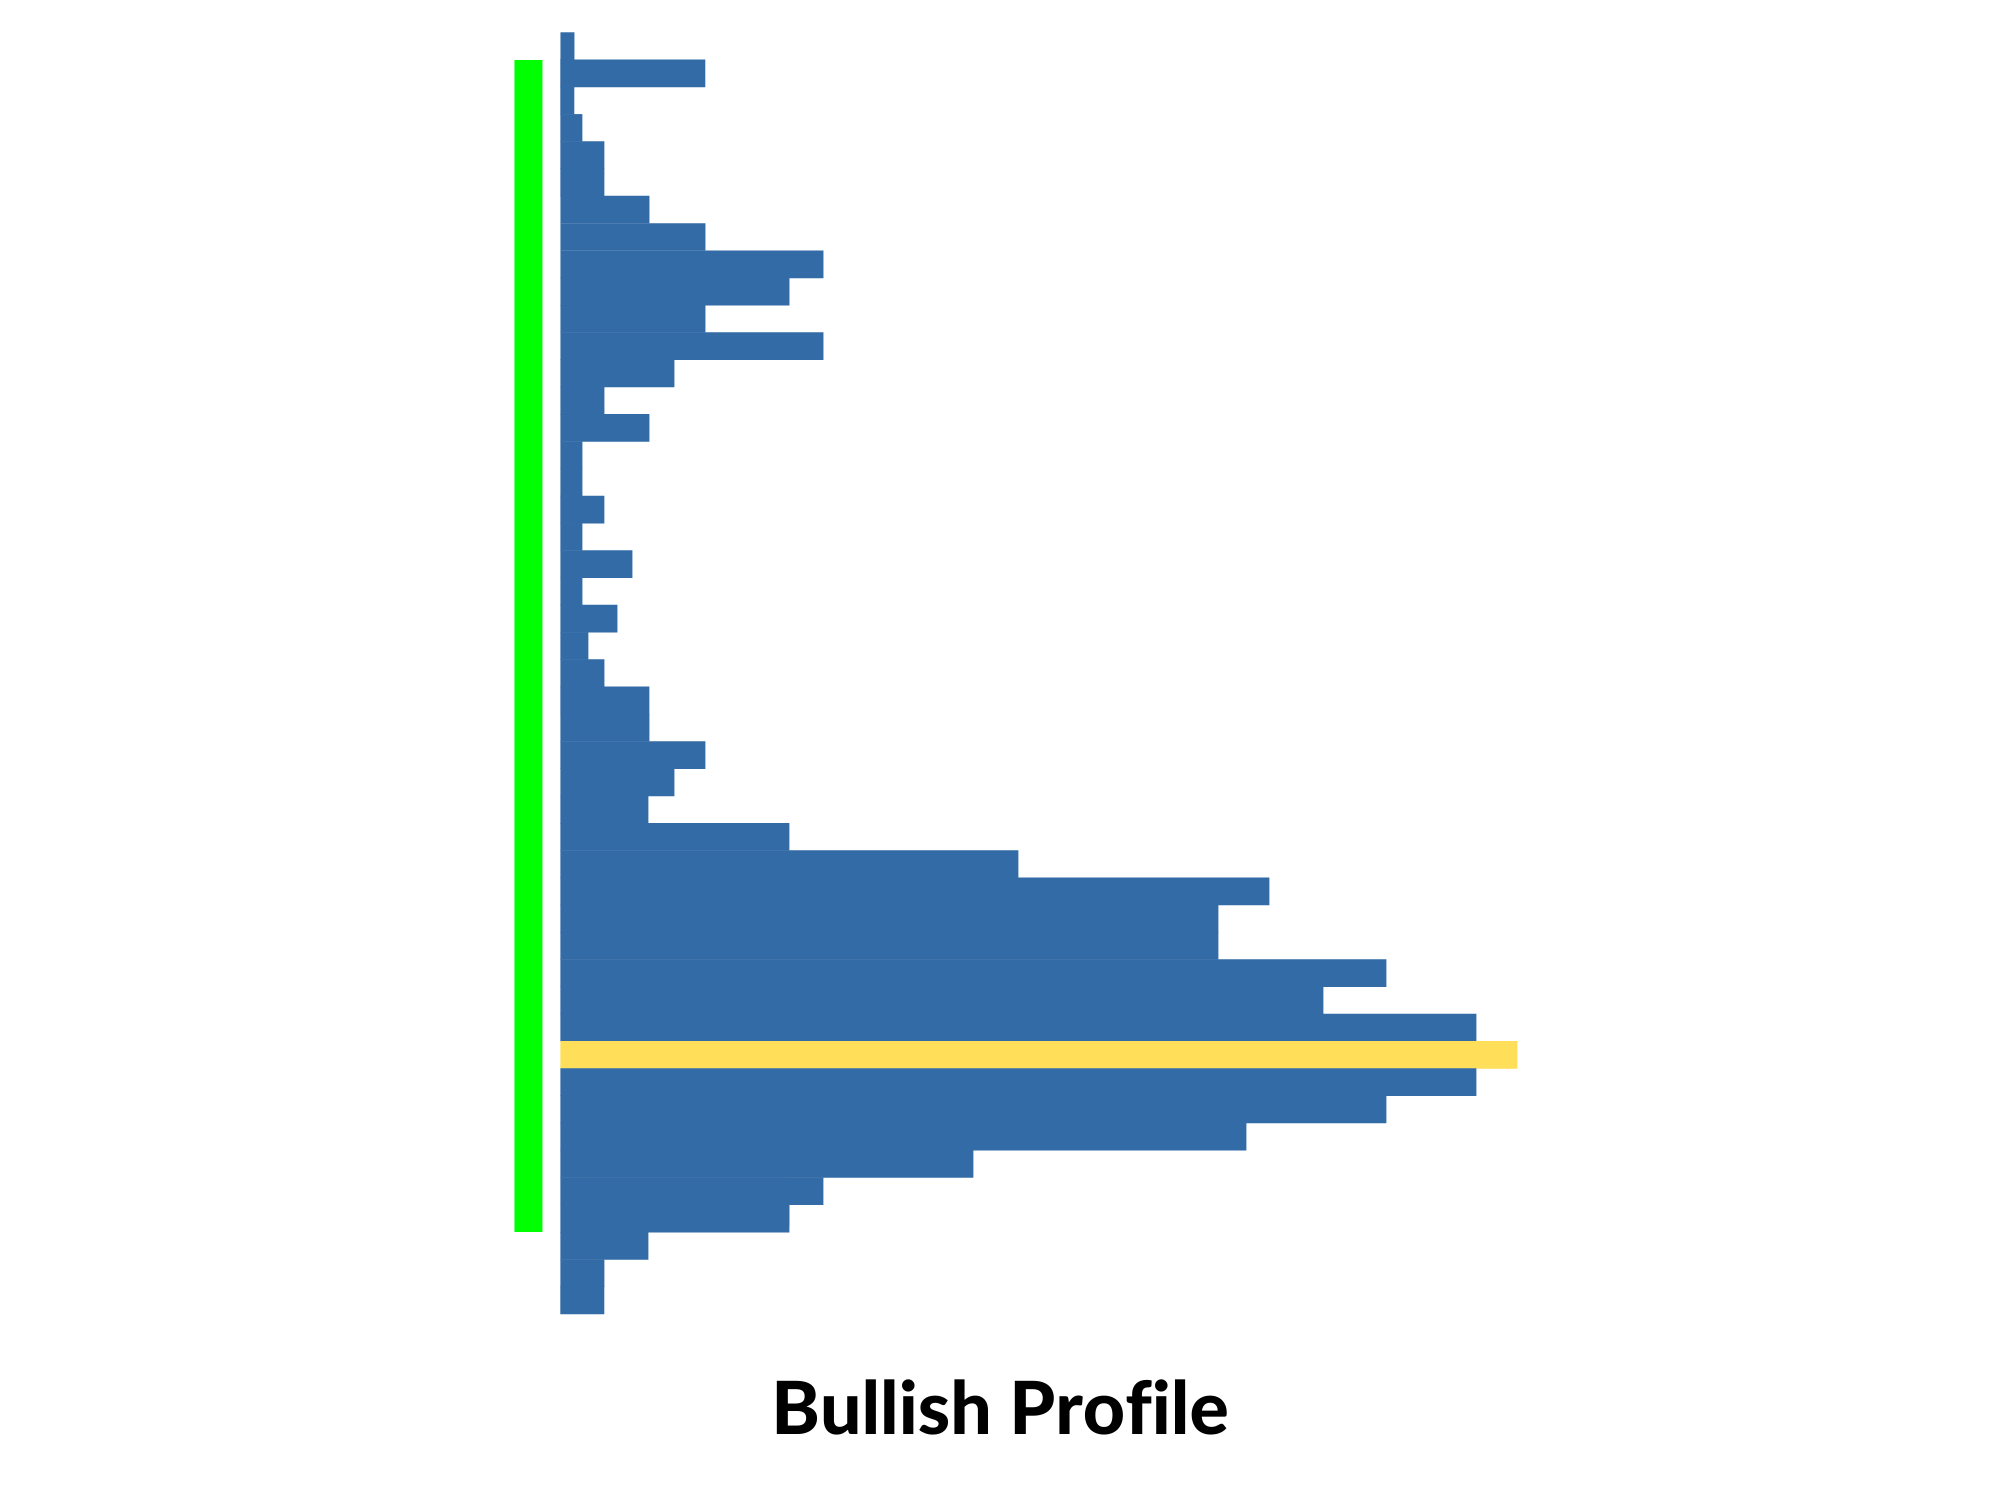
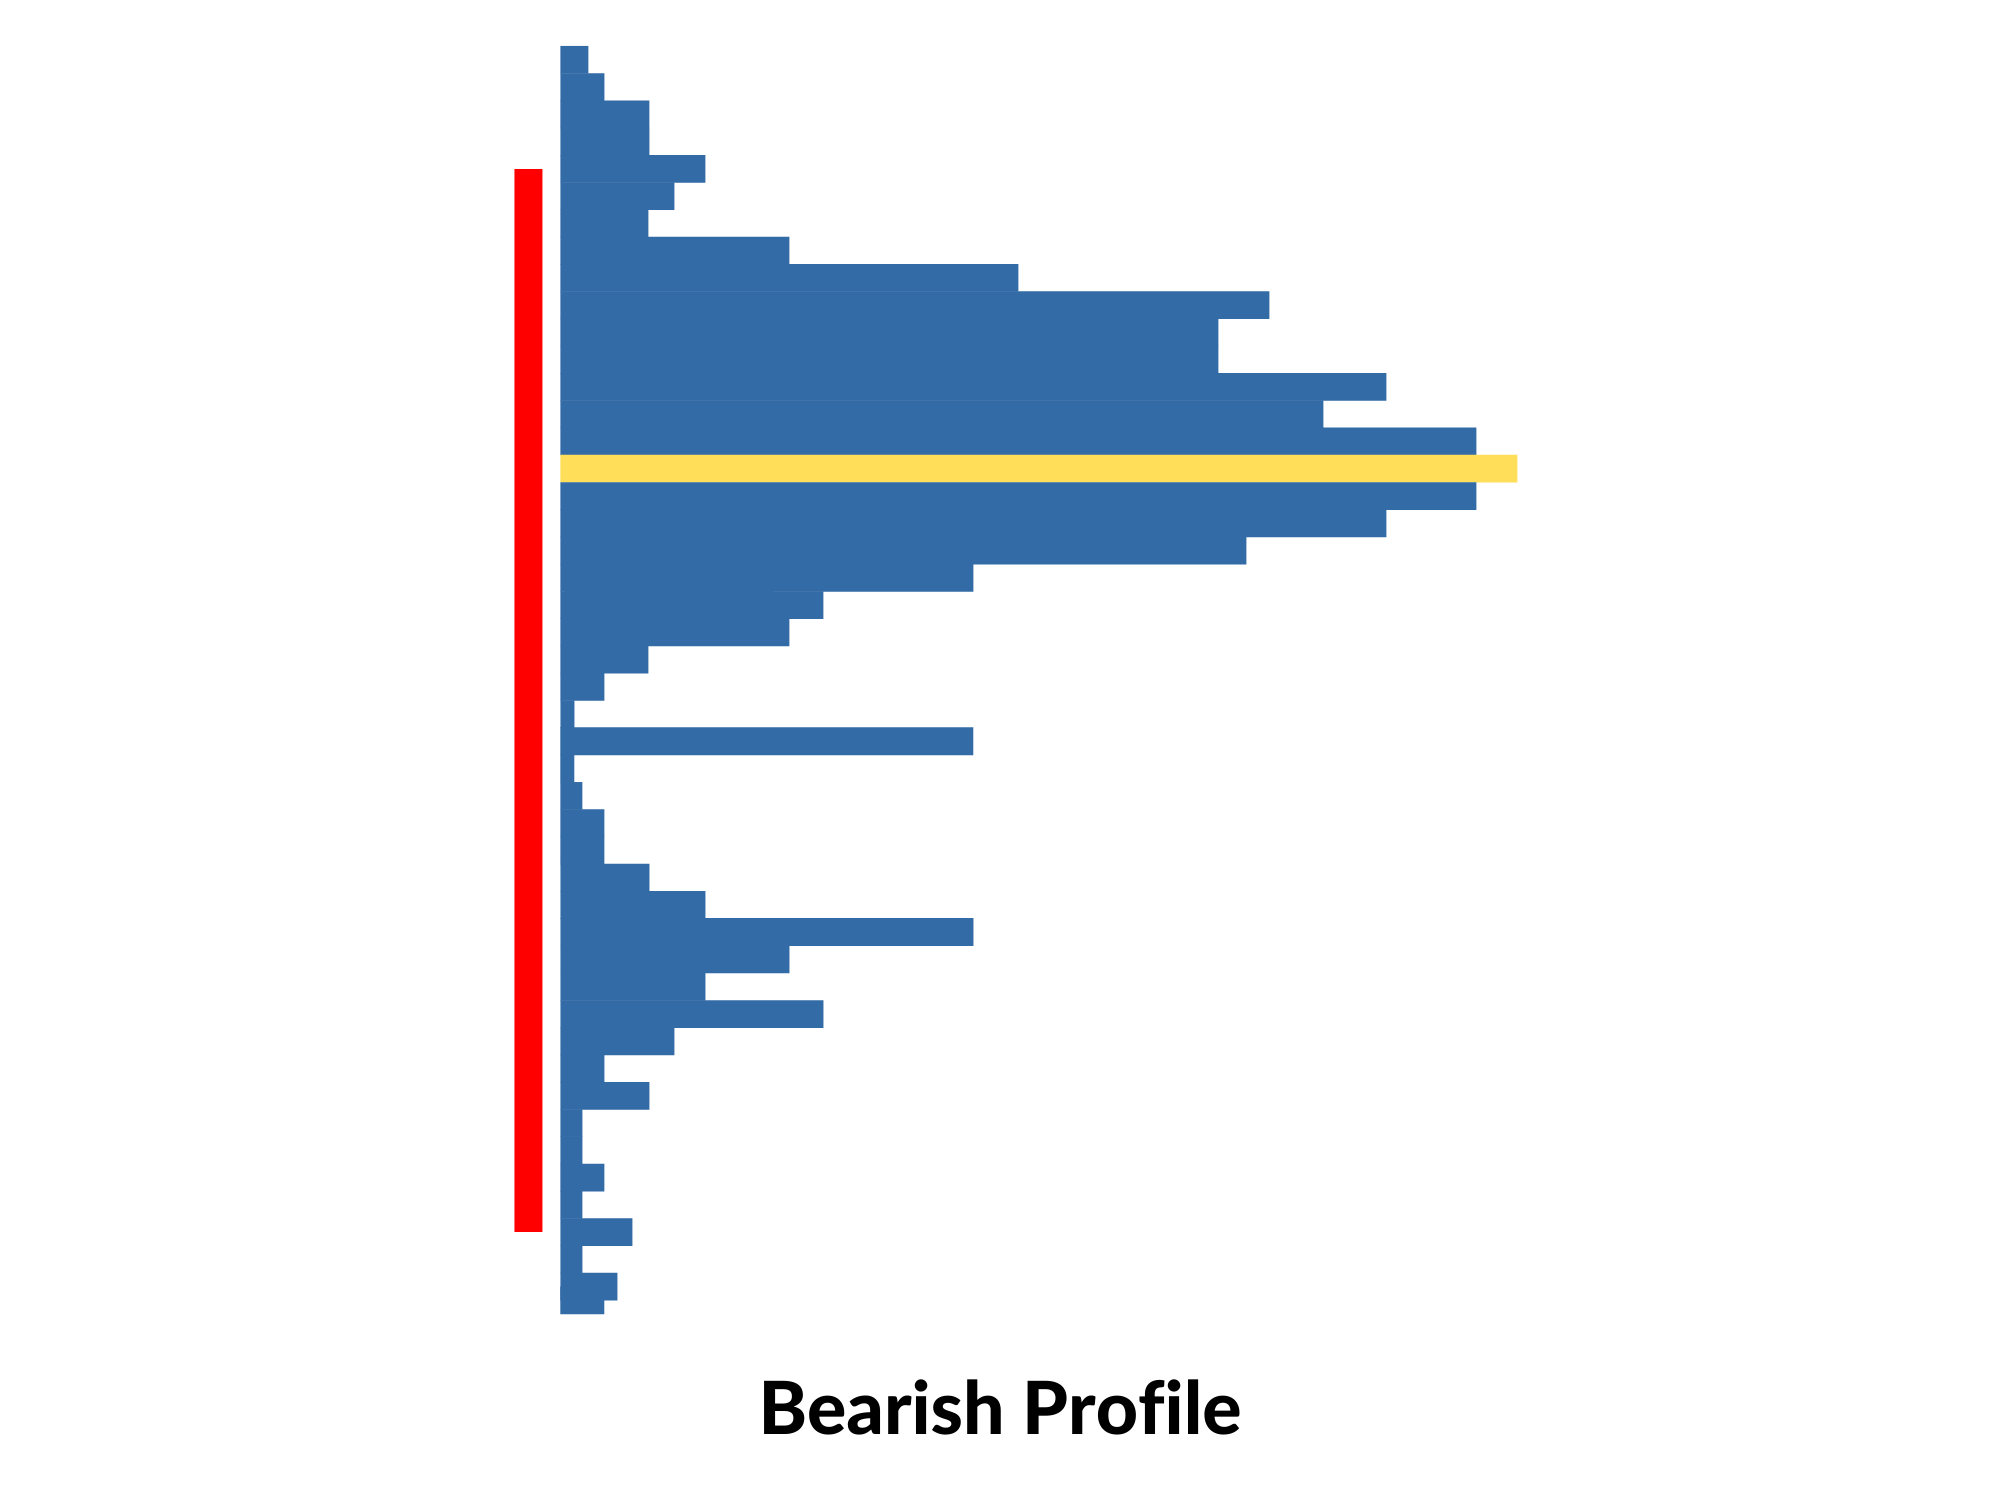
DETERMINE TREND WITH DISTRIBUTIONS
Volume profile distributions can help assess trend strength and spot potential reversal zones.
Bullish and Bearish Volume Profile Characteristics:
Price closes near highs (bullish) or lows (bearish)
Price is driving away from fair value, indicating early accumulation (bullish) or distribution (bearish)
Multiple HVNs and fewer LVNs
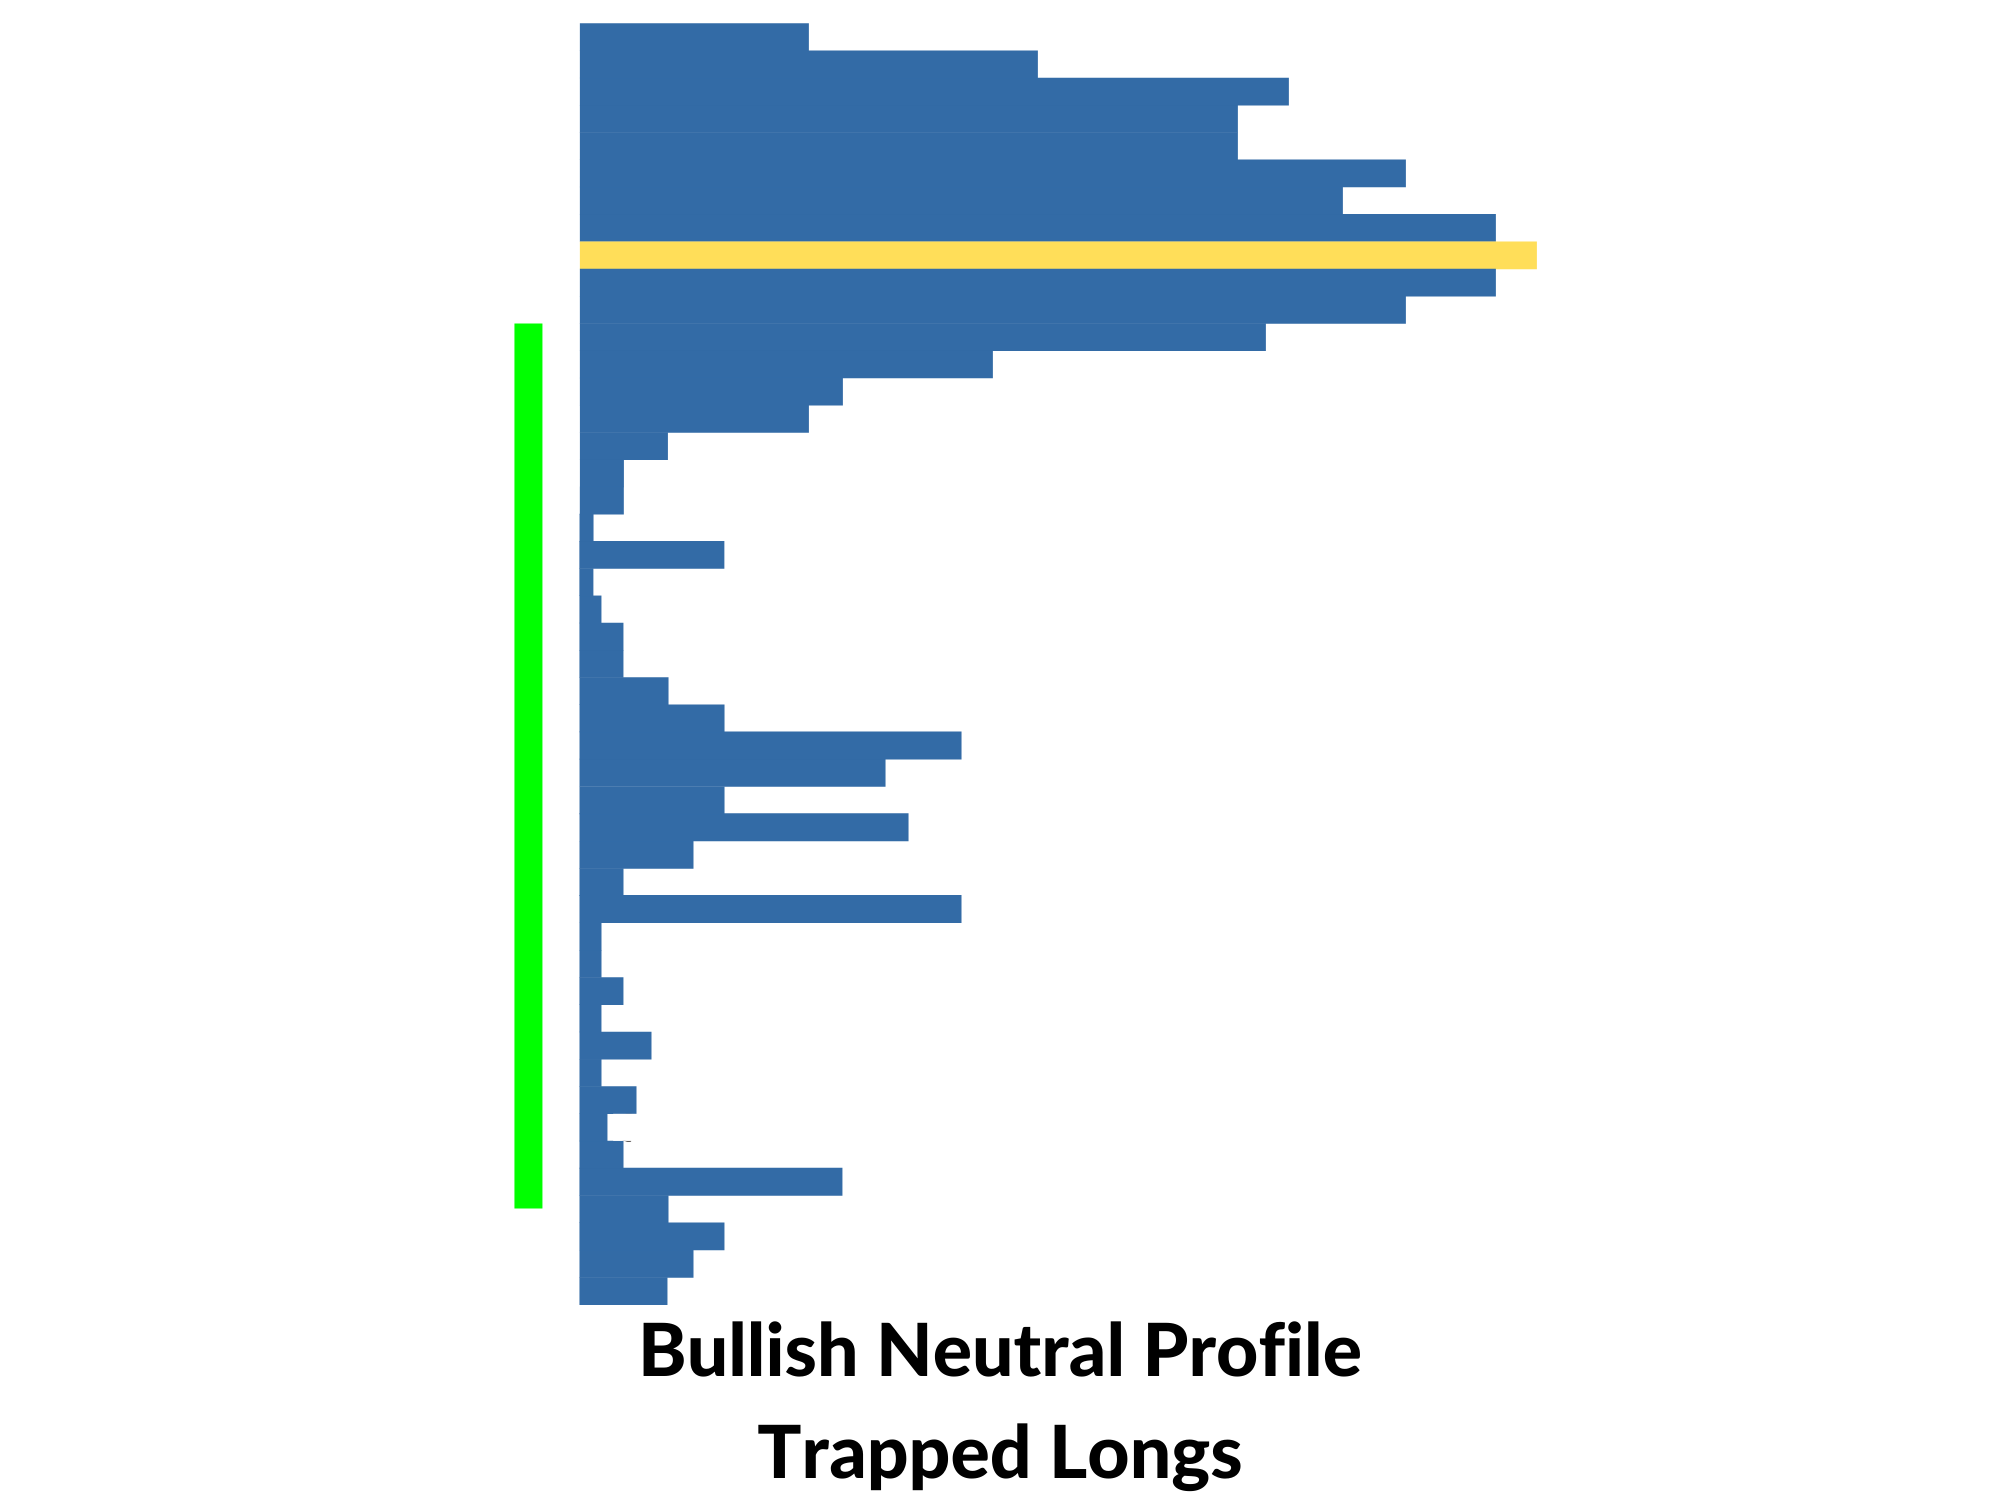
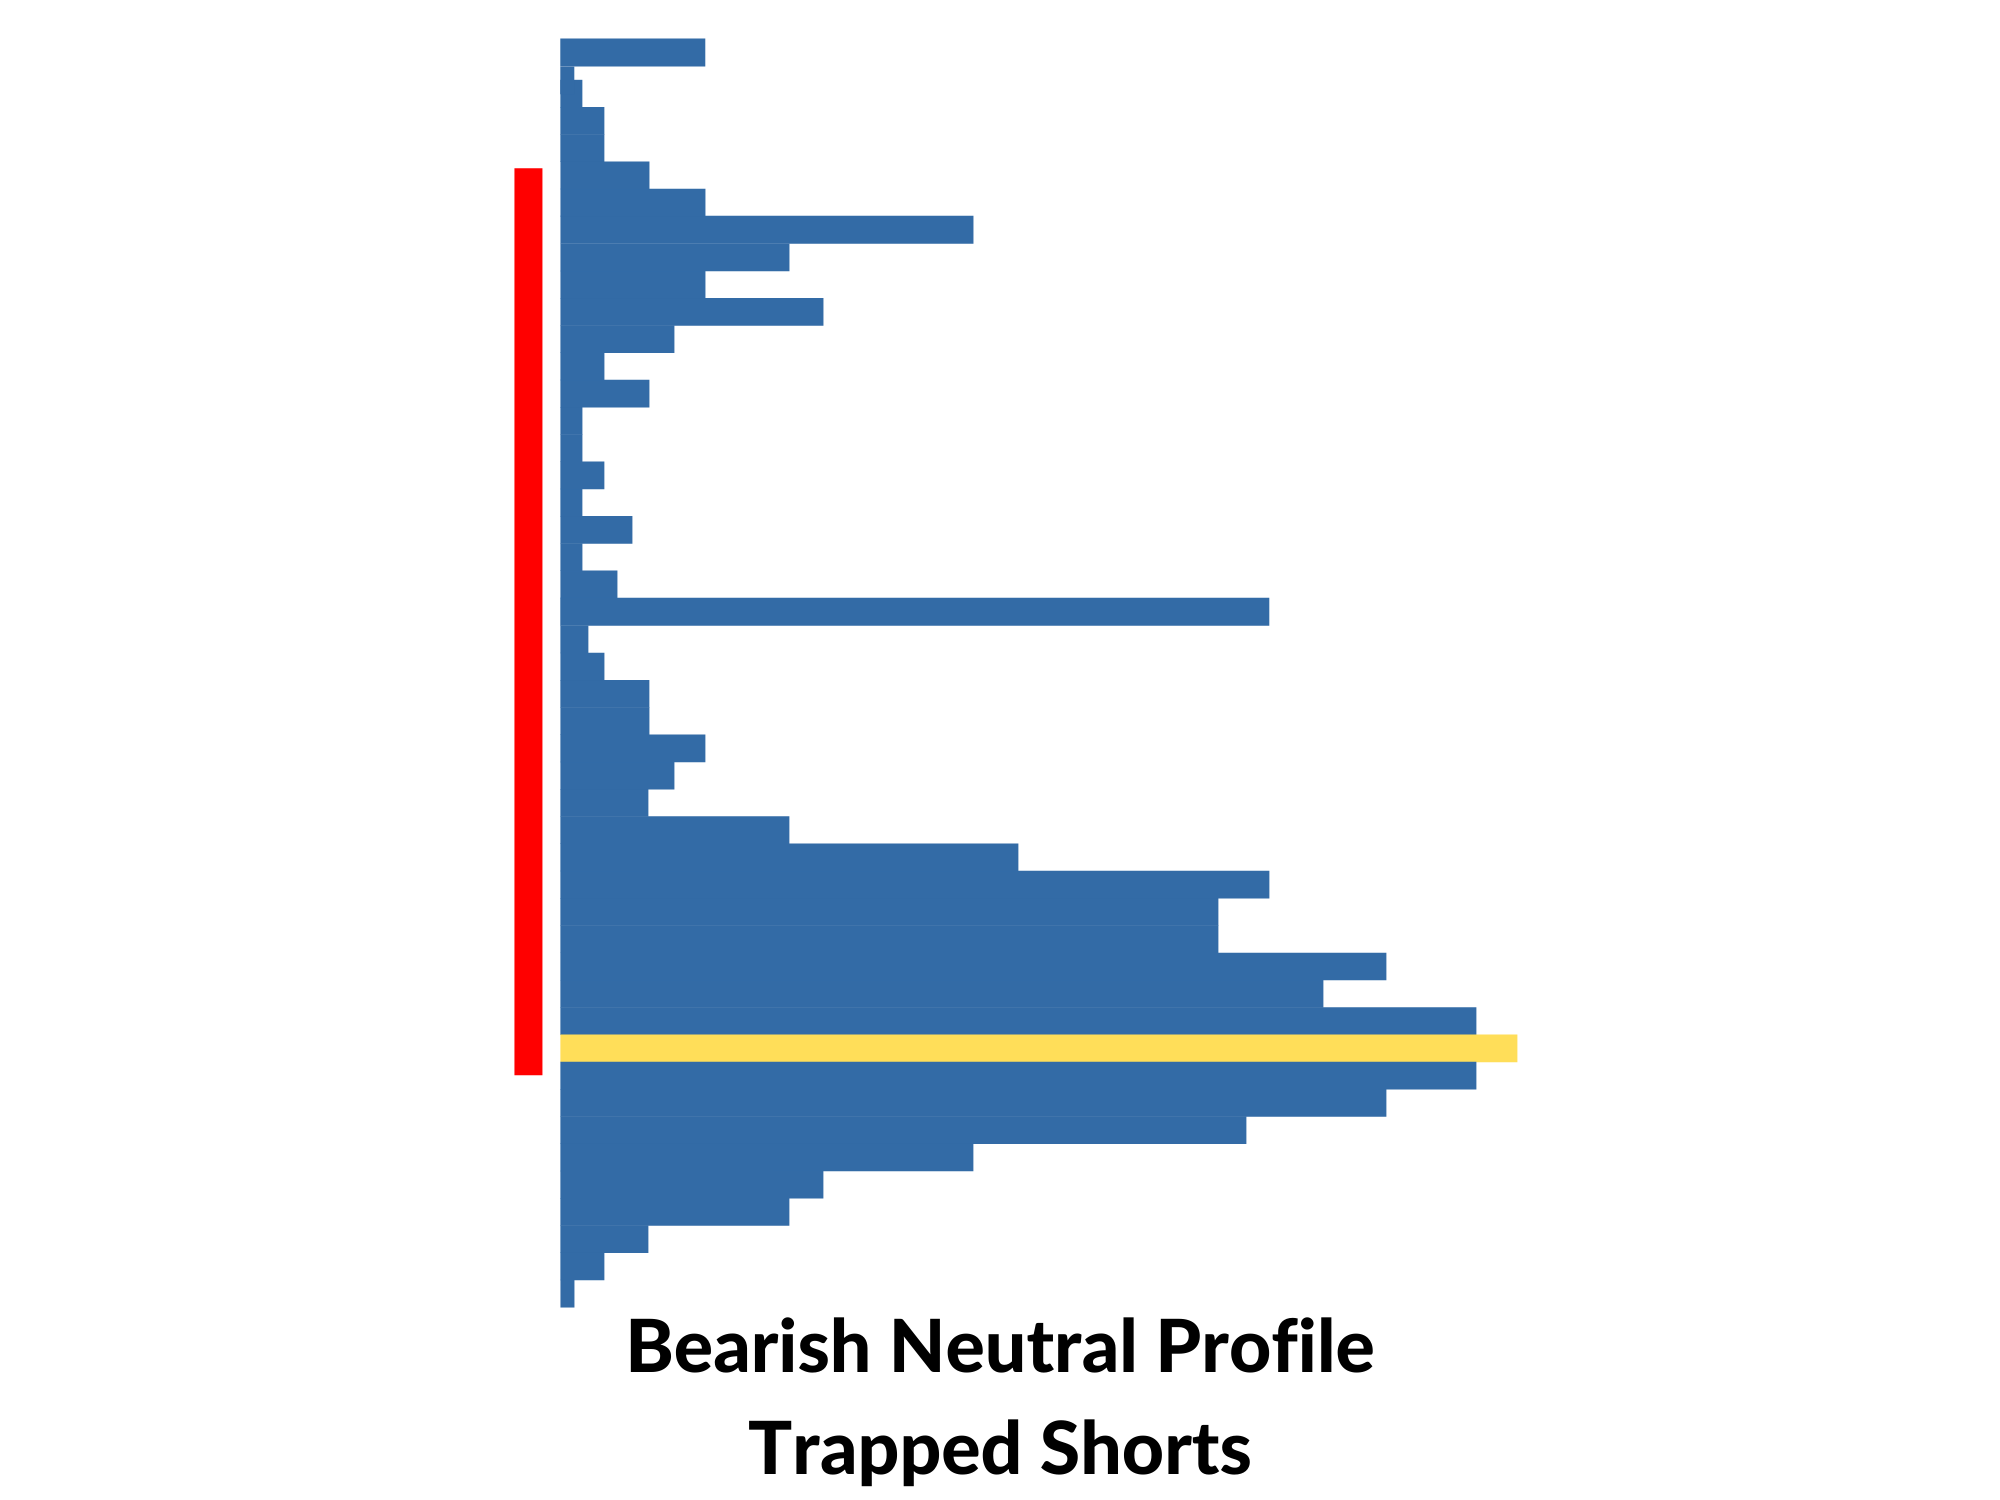
Bullish and Bearish Neutral Volume Profile Characteristics:
Price closes near highs (bullish) or lows (bearish)
Price closes inside or near fair value but does not close beyond
Watch for a reversal as there could be trapped traders
Key development for the Second Day Play - If you’re in the Trader’s Thinktank, you have heard me talk about this development a number of times. It is one of the most consistently profitable trading strategies, and it is largely based on volume profile.
KEY SUPPORT & RESISTANCE LEVELS
Use volume profiles to identify strong support and resistance levels on long-term charts. Stacked POCs on a weekly session profile can indicate the development of a robust level on higher timeframe charts.
DETERMINING VOLUME PROFILE TIME FRAMES
Your choice of time frames depends on your trading style:
For daily and weekly support and resistance levels, use daily and weekly volume profiles.
Intraday traders and scalpers often use 5, 15, 30, or 60-minute profiles to identify intraday support and resistance levels.
Remember that experimenting with different time frames is essential to continuously refine your trading edge. Personally, I prefer using the daily session profile and the 15-minute profile.
In conclusion, volume profiles are invaluable tools for traders, providing critical context for trading decisions and significantly enhancing performance. I advocate for keeping trading as simple as possible, relying primarily on absolutes such as price and volume—this is a phenomenal way to do that while improving your edge. Trading mastery comes with experience, so dedicate screen time to refine your skills. If you have any questions about volume profiles, please leave a comment below or send me a direct message in the Trader’s Thinktank.