
How To Use Volume Profile - A Complete Guide
If you want to improve your trading performance, understanding and implementing volume profiles is essential. After training hundreds of traders throughout my near-decade-long trading career, I've noticed a common issue among unprofitable traders: they often dive into trading setups and patterns without considering the broader context. Trading without context is not a strategy, it's merely trading patterns.
A successful trading strategy should not only define your edge but also specify the context in which you'll execute that edge. This is where analysis techniques such as multiple timeframe analysis and tools like volume profiles come into play.
Volume profiles are a key component of many of my strategies, and I believe they will enhance any trader’s edge - Especially those that focus on index products such as SPY, ES, or QQQ. By the end of this guide, you'll have a solid grasp of how to leverage volume profiles effectively.
What Is a Volume Profile?
A Volume Profile is an advanced charting indicator that unveils the total volume traded at every price level over a specified time period. Its applications in trading are profound, offering insights into crucial aspects like support and resistance levels, take profits, stop losses, trend strength, and market balance.
Identify Key Support and Resistance Levels for Setups
Determine Logical Take Profits and Stop Losses
Calculate the Initial R Multiplier
Identify Balanced vs. Imbalanced Markets
Determine the Strength of Trends
Now, let's delve into the essential components of a volume profile:
Volume Profile Components
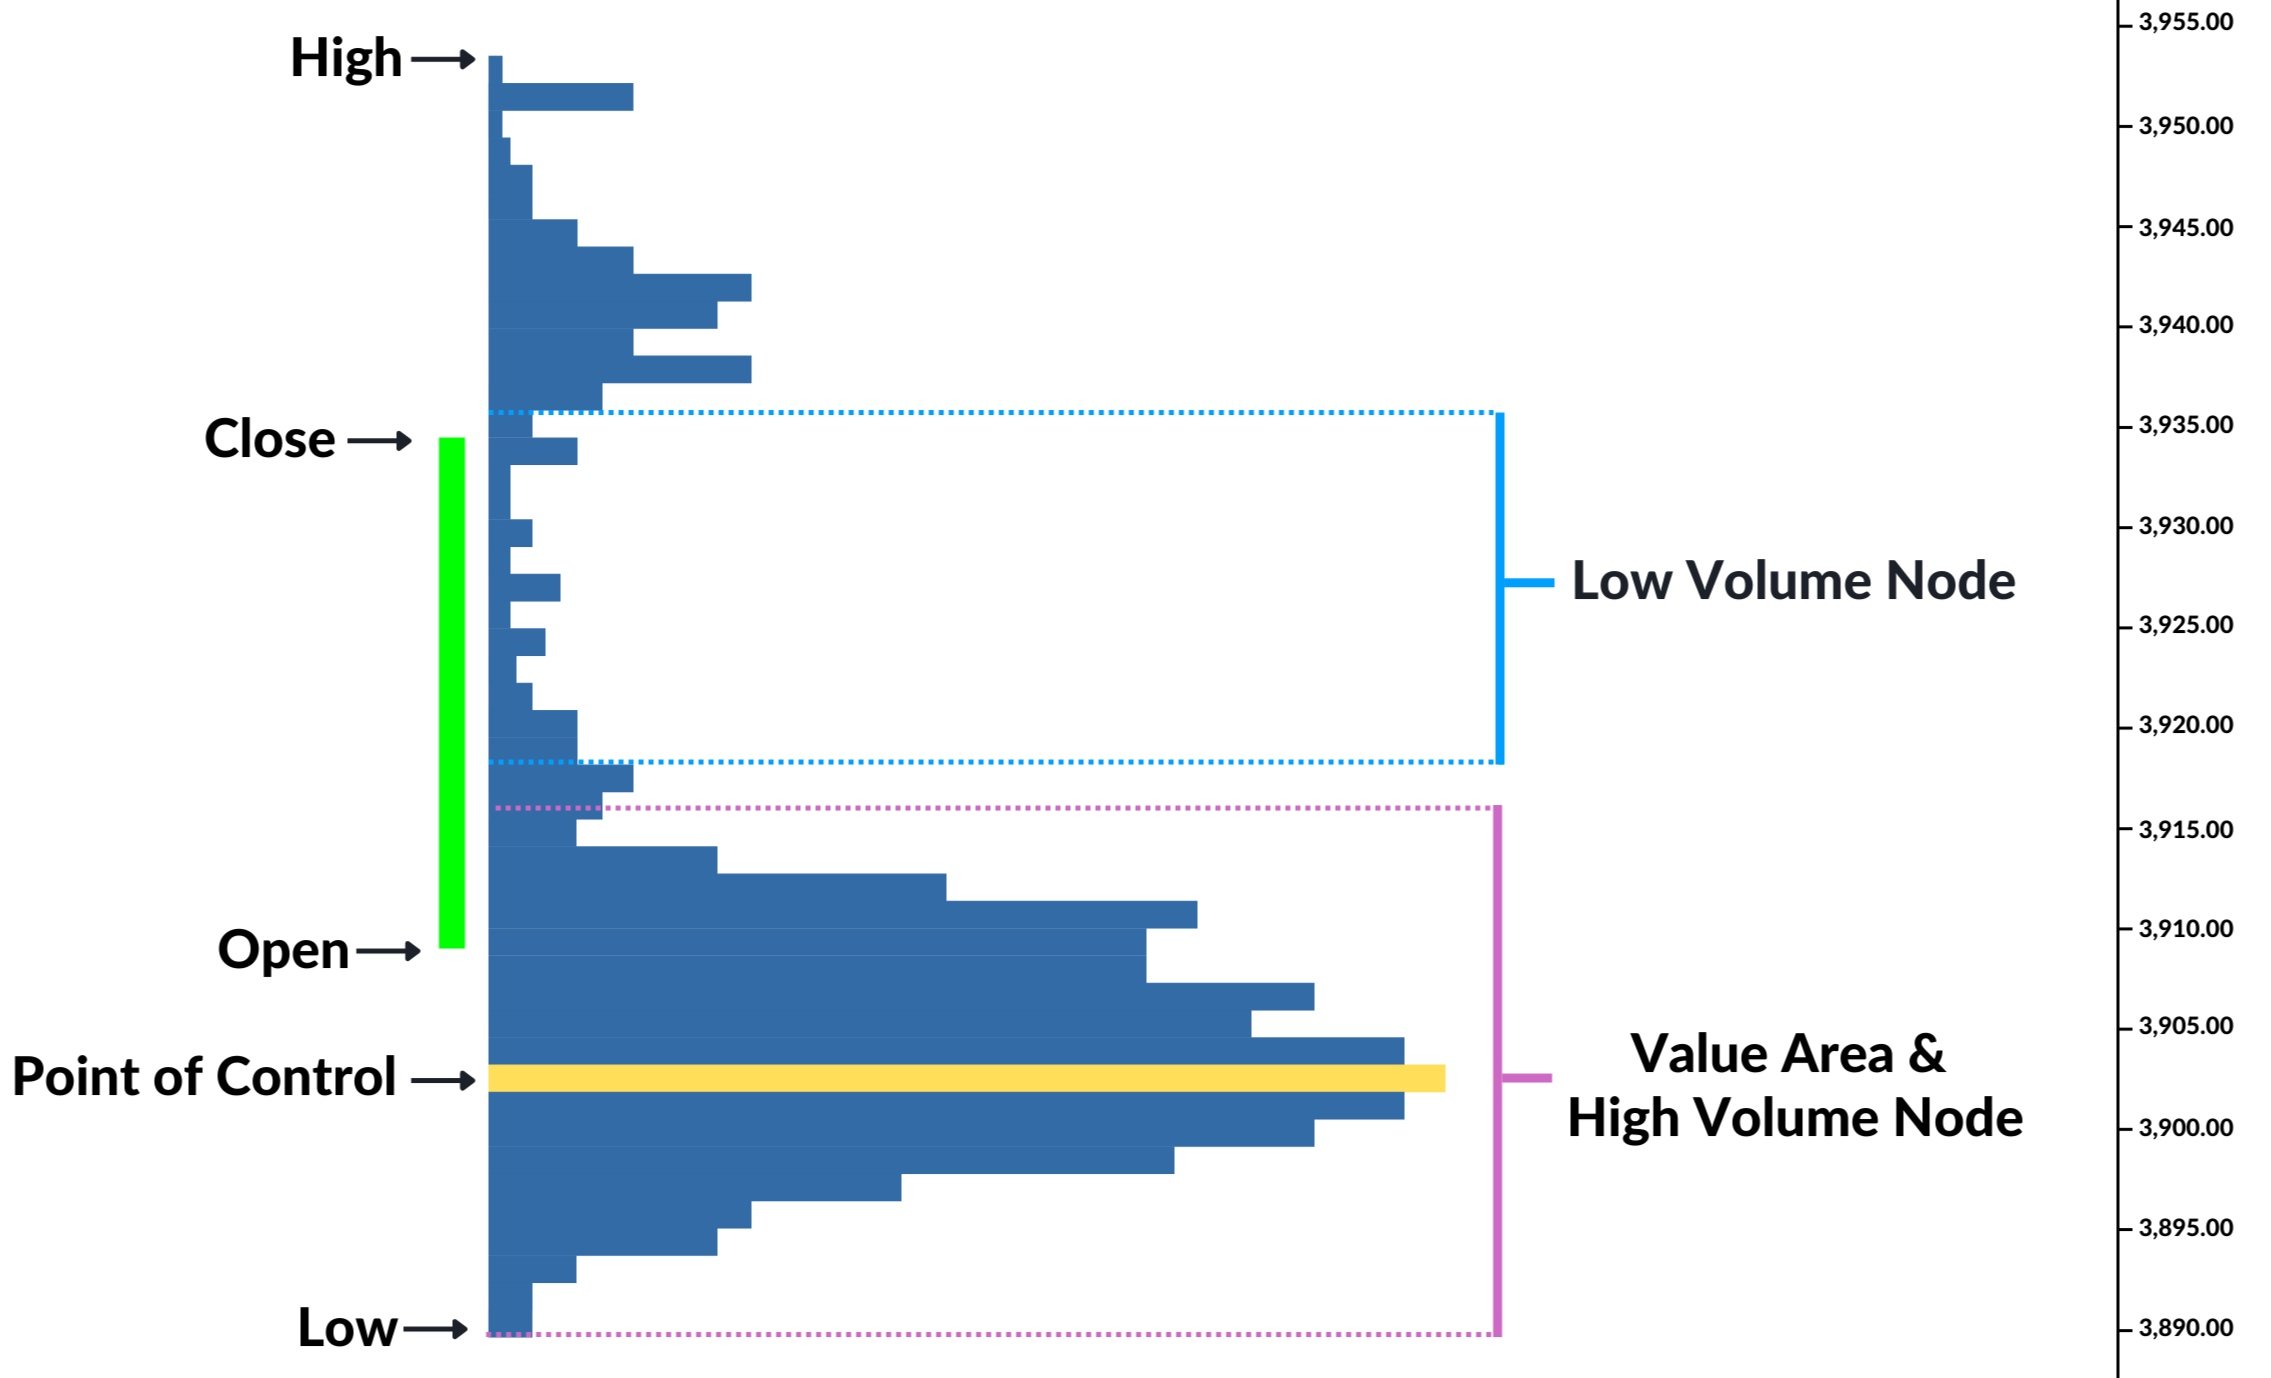
Open, High, Low, & Close (OHLC): These components are fundamental in various volume profile indicators.
Point of Control (POC): This is the price level where the most volume was traded during a session, often referred to as the POC. This is the main reference point I personally use with the volume profile.
Value Area (VA): The VA represents the price range where a user-specified percentage of volume was traded for a session. Traditionalists often use 70% because it's close to one standard deviation from the mean, which is represented by the Point of Control.
High Volume Node (HVN): HVNs are areas with high volume relative to the surrounding price action.
Low Volume Node (LVN): LVNs are areas with low volume relative to the surrounding price action.
Volume Profile Overview
Analyzing Price in Relation to Key Levels
Understanding the interplay between POCs, HVNs, and LVNs is crucial for building context around your trades. HVNs act like magnets, influencing price, while LVNs are low-liquidity zones where price tends to pass through quickly.
Volume Profile Indicators
Volume profiles can be configured in various ways, depending on the indicator and charting software you use. Let's explore different indicators and their best applications:
X-axis Volume: This is the traditional representation of volume on the x-axis. This version shows volume through time. It is the volume you are looking at near the bottom of your candlestick charts.
Session Profile: The session profile displays traded volume at each price level for a user-defined session, typically daily, weekly, or monthly.
Candlestick Volume Profile: Candlestick volume profiles, or volume footprints, can be valuable. They combine candlestick charts with volume profiles, providing powerful insights for both long-term and short-term trading. Personally, in experimenting with these, I found them to be a bit too noisy for my liking.
Volume Profile Strategies
Many new traders struggle because they trade patterns without considering context. Here are some strategies to improve your trading performance:
High Volume Node (HVN) Retracements
Look for trading setups near HVNs, as price tends to retrace to these levels. When price is trading below a high volume node or value area, the level will act as resistance. When price is trading above a high volume node or value area it will act as support.

High Volume Node (HVN) Retracements
Low Volume Node (LVN) Breakouts
LVNs are low-liquidity zones, ideal for breakout strategies when price makes decisive moves through them. If you are in the Trader’s Thinktank, you will hear me frequently talking about these concepts - Low volume nodes on higher timeframe charts can provide big moves. As a momentum trader, this is important information.
Determine Trend with Distributions
Volume profile distributions can help you assess trend strength and spot potential reversal zones.
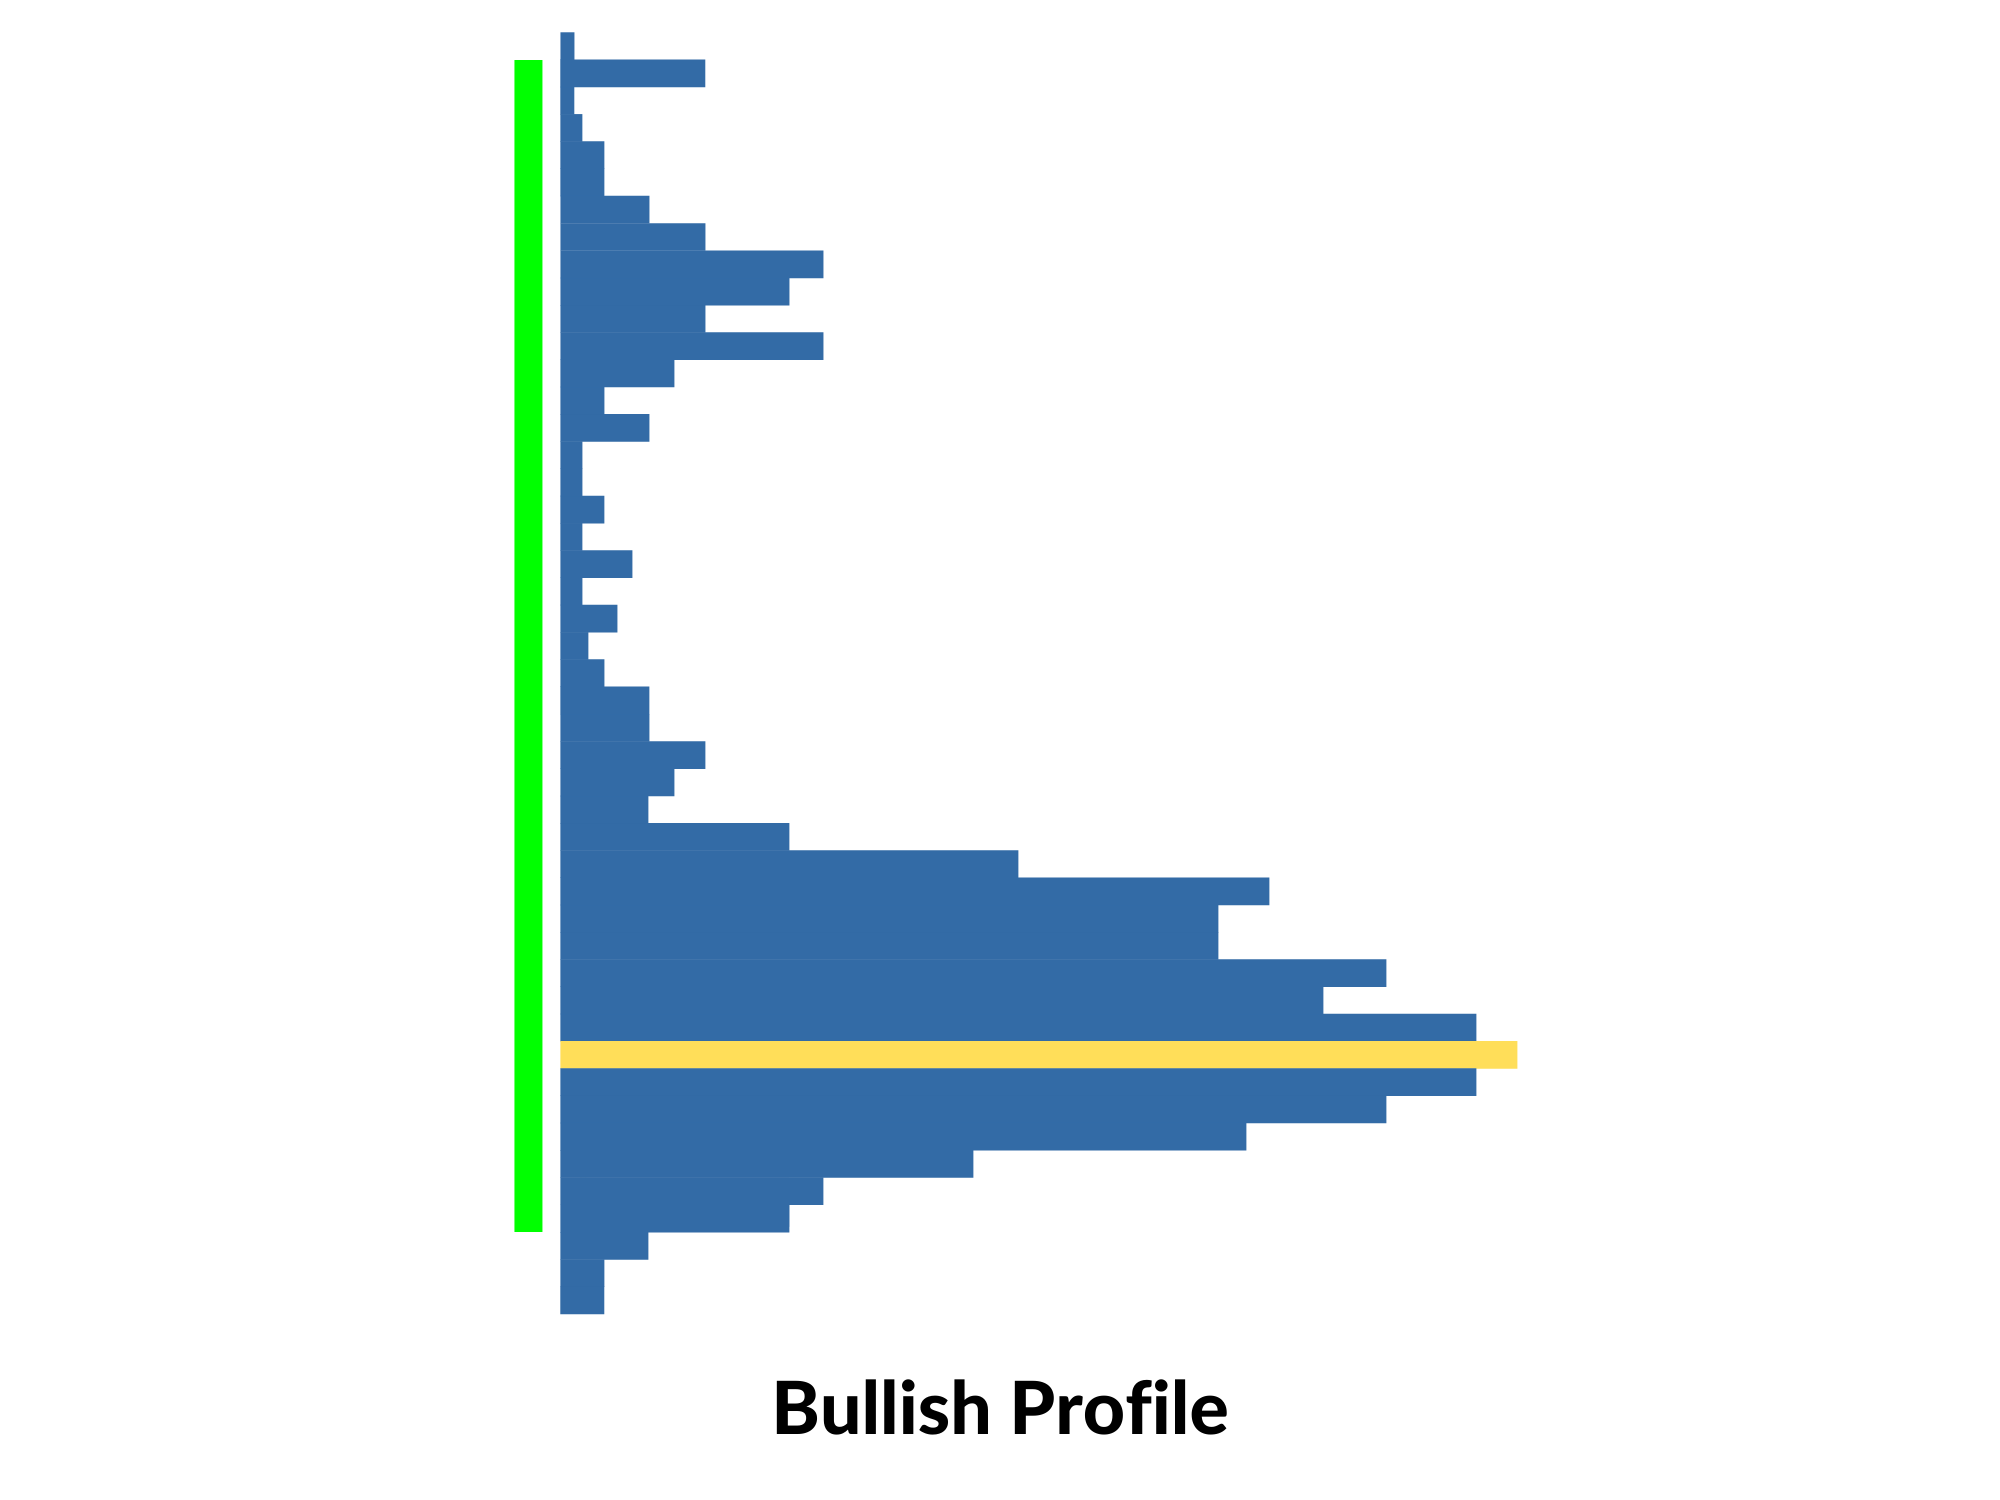
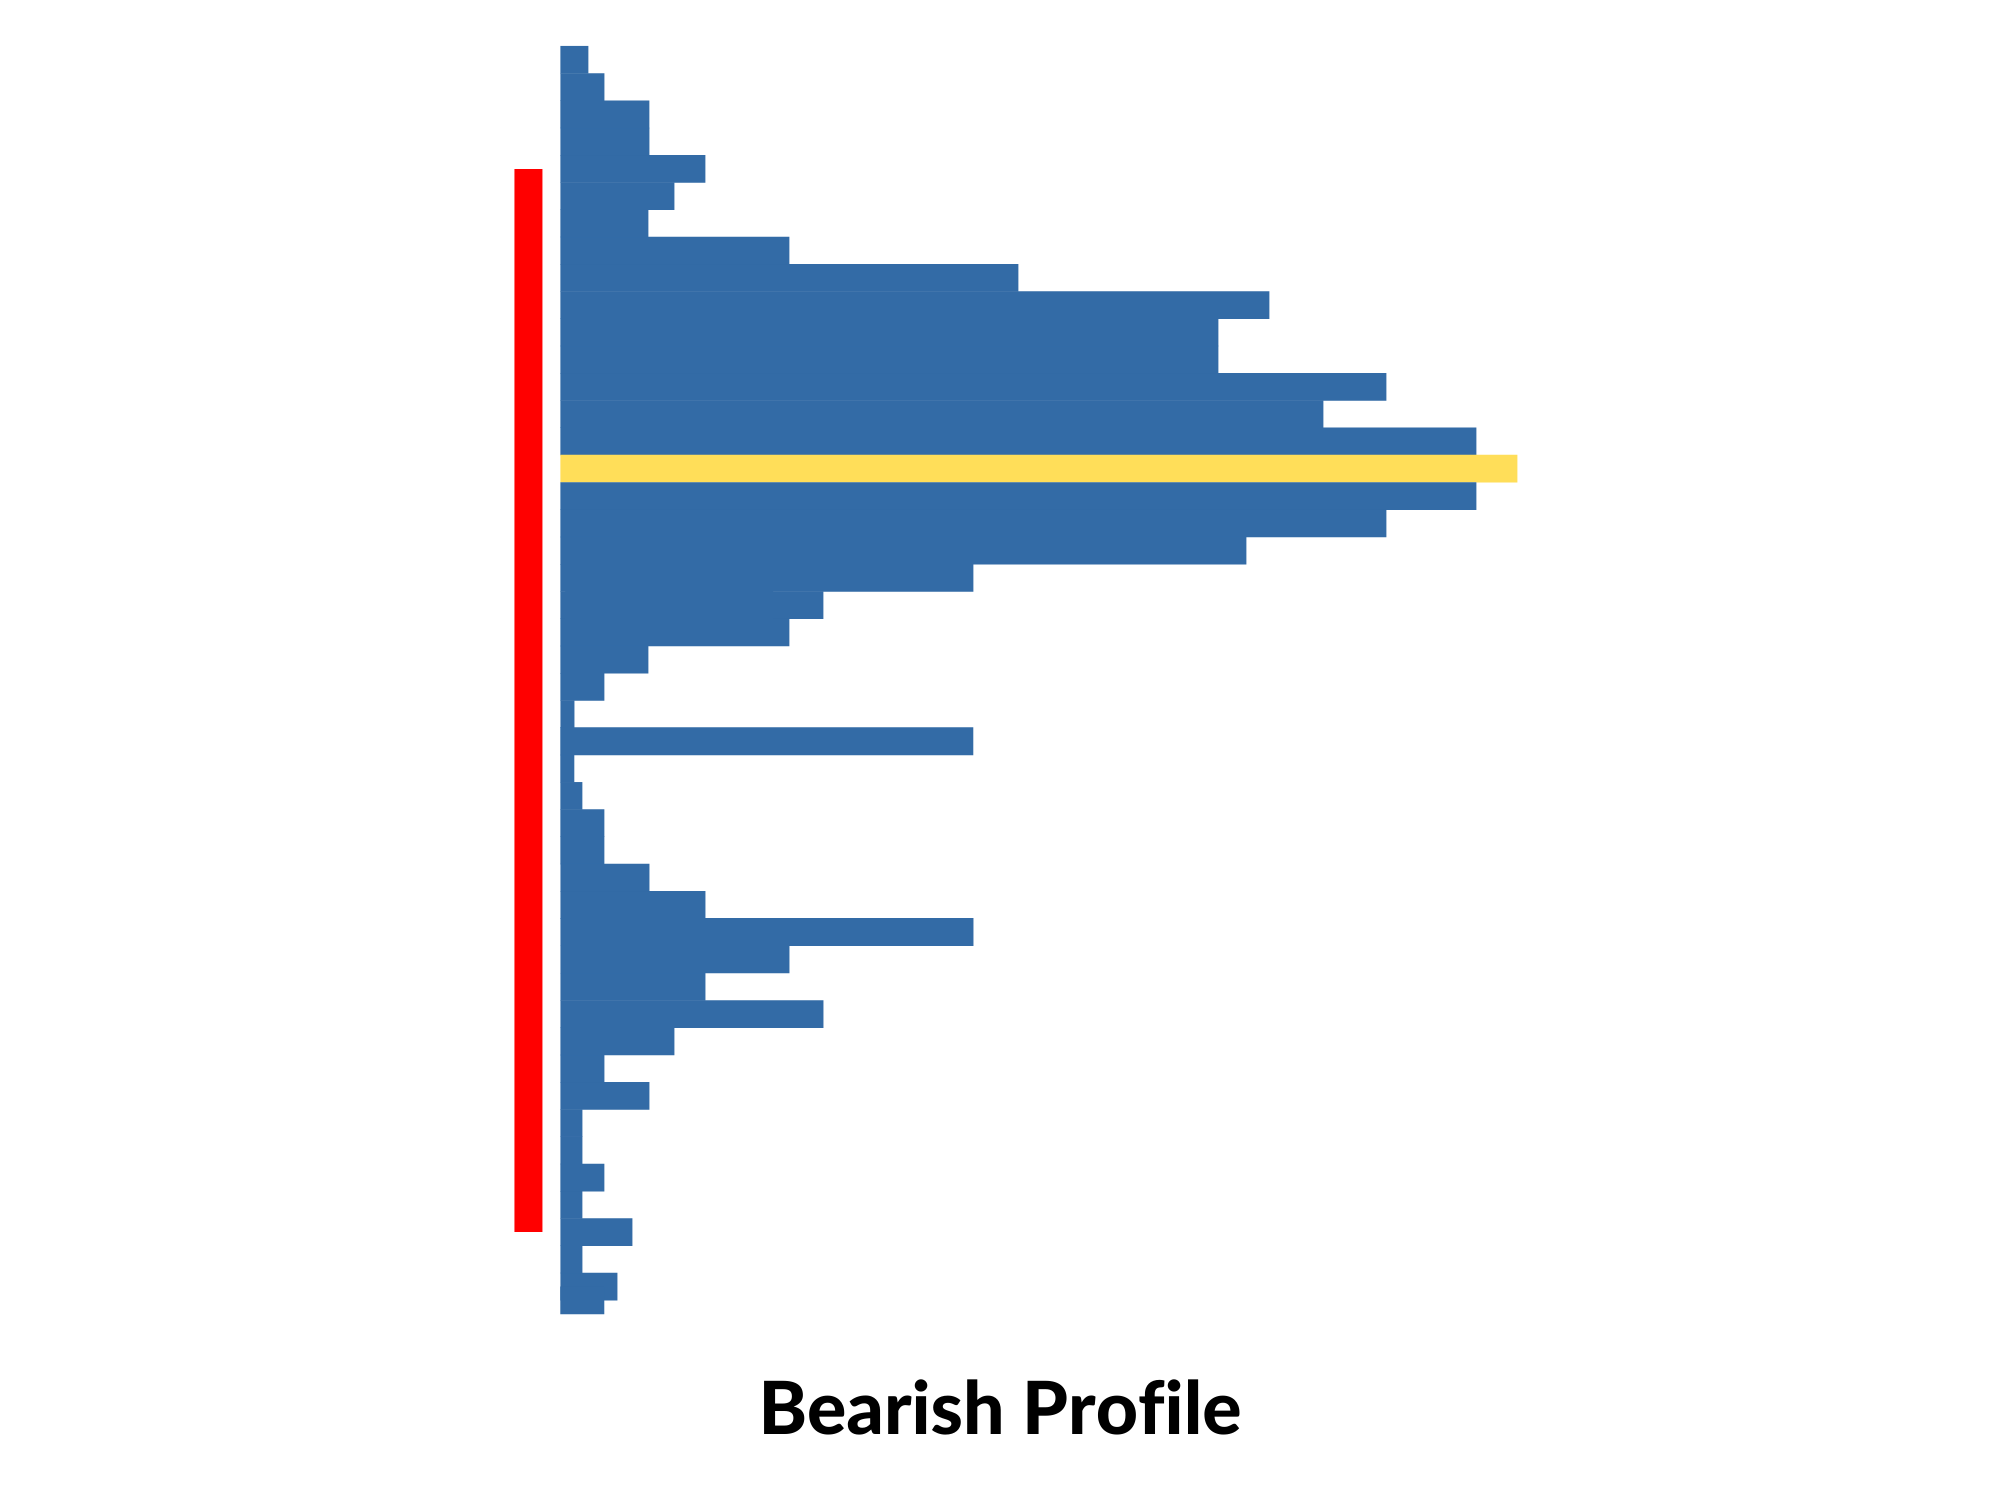
Bullish and Bearish Volume Profile Characteristics:
Price closes near highs (bullish) or lows (bearish)
Price is driving away from fair value - This tells that accumulation (bullish) or distribution (bearish) was done early in the move
Multiple HVN’s and fewer LVN’s
Bullish and Bearish Neutral Volume Profile Characteristics:
Price closes near highs (bullish) or lows (bearish)
Price closes inside or near fair value, but does not close beyond
Watch for a reversal as there could be trapped traders
Key development for the Second Day Play - If you’re in the Trader’s Thinktank, you have heard me talk about this development a number of times. It is one of the most consistently profitable trading strategies, and it is largely based on volume profile.


Key Support & Resistance Levels
Use volume profiles to identify strong support and resistance levels on long-term charts. Stacked POCs on a weekly session profile can show that a strong level is developing on the higher timeframe charts.
Determining Volume Profile Time Frames
The time frames you choose are influenced by your trading style. Brokers and charting platforms offer a range of options for setting profiles. For instance, there's a variable-range volume profile that adjusts according to the chart's timeframe. Additionally, you can choose options such as a weekly profile on a daily timeframe chart, revealing the development of the week's profile within the daily timeframe.
For daily and weekly support and resistance levels, use daily and weekly volume profiles.
Intraday traders and scalpers often use 5, 15, 30, or 60-minute profiles to identify intraday support and resistance levels.
As a developing trader, it's crucial to refine your trading edge by experimenting with various time frames. In my approach, I prefer utilizing the daily timeframe profile, the variable 15-minute profile, and a session profile on the 5-minute chart. As a day trader, integrating your intraday thesis with higher timeframe profiles is valuable in conducting a comprehensive multiple timeframe analysis, aligning you with the primary direction of the day.
Seasonal and Event-Based Considerations
Consider incorporating seasonal and event-based factors into your volume profile analysis. Certain periods may exhibit unique trading characteristics influenced by market events or seasonal trends.
In conclusion, volume profiles are invaluable tools for traders. They offer a critical context for your trading decisions and can significantly enhance your performance. I am a huge proponent of keeping trading as simple as possible and relying primarily on absolutes such as price and volume - This is a phenomenal way to do that, all while improving your edge. Keep in mind that trading mastery comes with experience, so dedicate screen time to refine your skills. If you have any questions about volume profiles, please leave a comment below. Start using volume profiles to boost your trading performance today!